Unlock a world of possibilities! Login now and discover the exclusive benefits awaiting you.
- Qlik Community
- :
- All Forums
- :
- QlikView App Dev
- :
- Re: Delivery Gauge Chart
- Subscribe to RSS Feed
- Mark Topic as New
- Mark Topic as Read
- Float this Topic for Current User
- Bookmark
- Subscribe
- Mute
- Printer Friendly Page
- Mark as New
- Bookmark
- Subscribe
- Mute
- Subscribe to RSS Feed
- Permalink
- Report Inappropriate Content
Delivery Gauge Chart
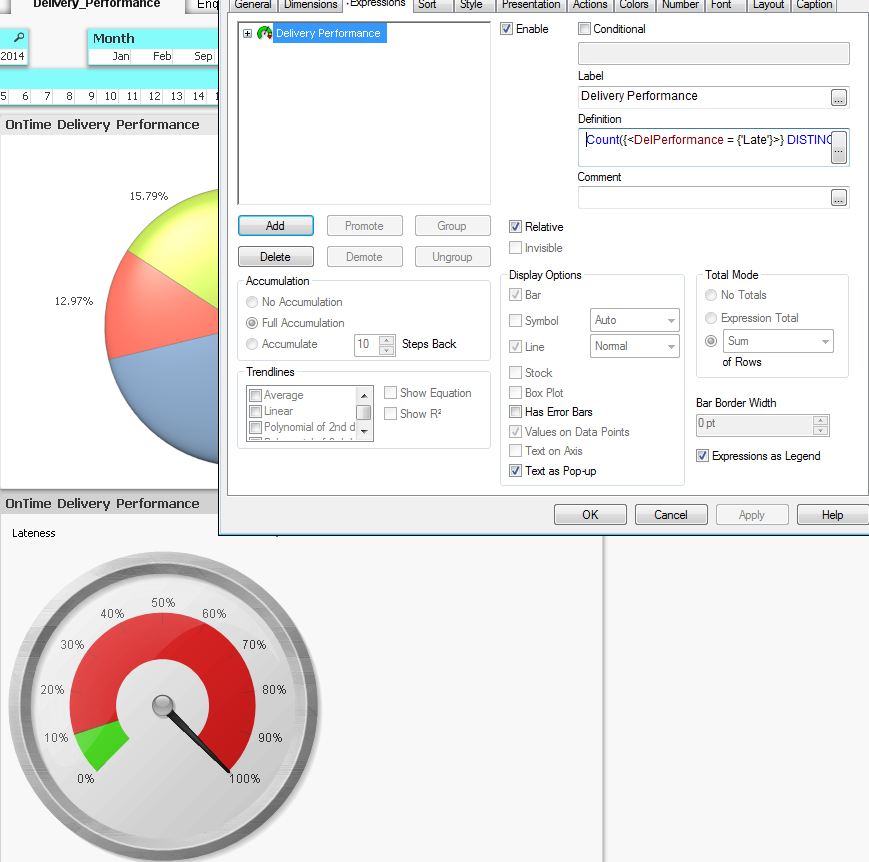
I have a good working pie chart that shows delivery performance (by using proceeding load). it splits late, early and ontime in to percentages and works very nicely. i wanted to then have a second chart as a Gauge to show unnacceptable lateness - ie over 10% the needle goes into red.
I cannot for the life of me work out what i have to put in the expression to get this, i tried:
Sum(DelPerformance = 'Late') / Sum(DelPerformance) ... but this obviously didnt work, can any one help?
this is the data that is in the script that the pie chart which works fine is looking at:
LOAD *,
If(DelPerf =0, 'OnTime',
If(DelPerf >=1, 'Early',
If(DelPerf <=-1, 'Late'))) AS DelPerformance;
LOAD Invoice,
LineShipDate,
CustRequestDate,
(CustRequestDate-LineShipDate) AS DelPerf;
Accepted Solutions
- Mark as New
- Bookmark
- Subscribe
- Mute
- Subscribe to RSS Feed
- Permalink
- Report Inappropriate Content
Hi
You need something like this:
Count({<DelPerformance = {'Late'}>} DISTINCT Invoice) / Count(DISTINCT Invoice)
HTH
Jonathan
- Mark as New
- Bookmark
- Subscribe
- Mute
- Subscribe to RSS Feed
- Permalink
- Report Inappropriate Content
Hi
You need something like this:
Count({<DelPerformance = {'Late'}>} DISTINCT Invoice) / Count(DISTINCT Invoice)
HTH
Jonathan
- Mark as New
- Bookmark
- Subscribe
- Mute
- Subscribe to RSS Feed
- Permalink
- Report Inappropriate Content
no that didnt work,
am i correct in thinking there shouldnt be any dimensions?
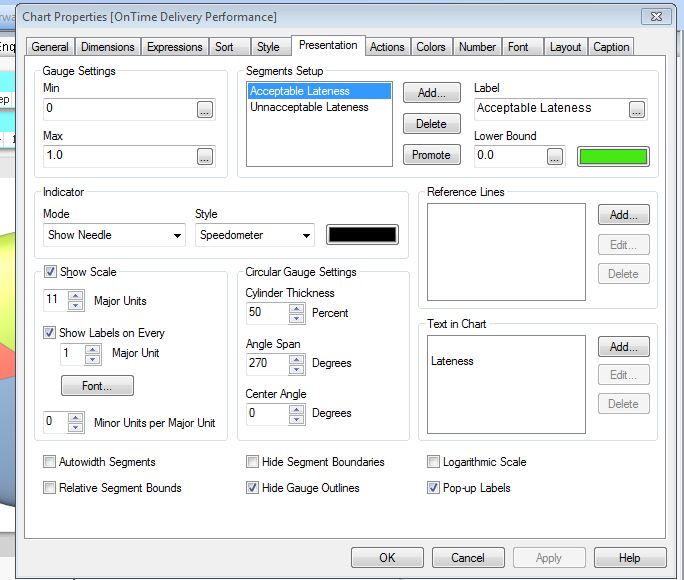
attached are screen shots of the chart pres and expression

- Mark as New
- Bookmark
- Subscribe
- Mute
- Subscribe to RSS Feed
- Permalink
- Report Inappropriate Content
Dear James,
Try Below expression
=Count(Distinct {<DelPerformance = {"Late"},DelPerf={"<=0.1"}>} Invoice)
Regards
Kiran
- Mark as New
- Bookmark
- Subscribe
- Mute
- Subscribe to RSS Feed
- Permalink
- Report Inappropriate Content
Please attach Sample application for better understanding..
- Mark as New
- Bookmark
- Subscribe
- Mute
- Subscribe to RSS Feed
- Permalink
- Report Inappropriate Content
whats best way to do that?
- Mark as New
- Bookmark
- Subscribe
- Mute
- Subscribe to RSS Feed
- Permalink
- Report Inappropriate Content
just take dummy data and make sample application and describe your desired result in that application
- Mark as New
- Bookmark
- Subscribe
- Mute
- Subscribe to RSS Feed
- Permalink
- Report Inappropriate Content
this is the script where the info pulls from (invoice is what joins it to the other tables)
LOAD *,
If(DelPerf =0, 'OnTime',
If(DelPerf >=1, 'Early',
If(DelPerf <=-1, 'Late'))) AS DelPerformance;
LOAD Invoice,
LineShipDate,
CustRequestDate,
(CustRequestDate-LineShipDate) AS DelPerf;
SQL SELECT Invoice,
LineShipDate,
CustRequestDate
FROM SysproCompanyA.dbo.SorDeliveryPerf;
i want to show via a gauge a pointer that shows where we are on lateness ie whether its at an acceptable level at under 10% (green) or an unnacceptable level over 10% (red).
Might be best to start the gauge set up from scratch just incase ive done something wrong in the presentation?
- Mark as New
- Bookmark
- Subscribe
- Mute
- Subscribe to RSS Feed
- Permalink
- Report Inappropriate Content
This one actually worked in the end - i redid the gauge from scratch and it worked so i mustve selected something wrong in the set up.. thanks for everyones help