Unlock a world of possibilities! Login now and discover the exclusive benefits awaiting you.
- Qlik Community
- :
- All Forums
- :
- QlikView App Dev
- :
- Difference from 2 columns in horizontal straight t...
- Subscribe to RSS Feed
- Mark Topic as New
- Mark Topic as Read
- Float this Topic for Current User
- Bookmark
- Subscribe
- Mute
- Printer Friendly Page
- Mark as New
- Bookmark
- Subscribe
- Mute
- Subscribe to RSS Feed
- Permalink
- Report Inappropriate Content
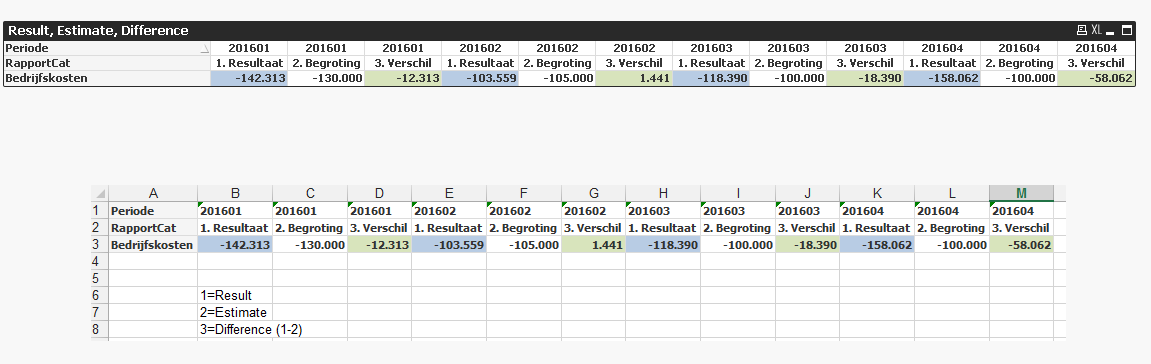
Difference from 2 columns in horizontal straight table
Dear all,
can you help me out on this challenge. Attached is a QlikView document with a horzizontal straight table. Now column 3 should show the difference between the 1st and second but I can't get it right.
The correct numbers are in the excel screendump, shown in a text object.
I know the datamodel is worse, but the customer begged me for a solution in the expressions of the graphs.
Thanks in advance you all.
Bart.
Accepted Solutions
- Mark as New
- Bookmark
- Subscribe
- Mute
- Subscribe to RSS Feed
- Permalink
- Report Inappropriate Content
Try this:
if(RapportCat='Begroting',
sum({<PrognoseVersie={'$(vPrognoseVersie)'}>}Bedrijfskosten),
if(RapportCat='Verschil'
,
sum(TOTAL <RapportPeriode>{<RapportCat = {'Resultaat', 'Prognose'}>}Bedrijfskosten)
+
sum({<PrognoseVersie={'$(vPrognoseVersie)'}>}Bedrijfskosten)
,
sum(Bedrijfskosten)
) )
- Mark as New
- Bookmark
- Subscribe
- Mute
- Subscribe to RSS Feed
- Permalink
- Report Inappropriate Content
Use this show totals but suppress values in pivot table aproach by stalwar1
- Mark as New
- Bookmark
- Subscribe
- Mute
- Subscribe to RSS Feed
- Permalink
- Report Inappropriate Content
Hi Clever,
thanks for the reply but that gives me totals, not the difference.
But again, thx for the reply.
Bart
- Mark as New
- Bookmark
- Subscribe
- Mute
- Subscribe to RSS Feed
- Permalink
- Report Inappropriate Content
Try this:
if(RapportCat='Begroting',
sum({<PrognoseVersie={'$(vPrognoseVersie)'}>}Bedrijfskosten),
if(RapportCat='Verschil'
,
sum(TOTAL <RapportPeriode>{<RapportCat = {'Resultaat', 'Prognose'}>}Bedrijfskosten)
+
sum({<PrognoseVersie={'$(vPrognoseVersie)'}>}Bedrijfskosten)
,
sum(Bedrijfskosten)
) )
- Mark as New
- Bookmark
- Subscribe
- Mute
- Subscribe to RSS Feed
- Permalink
- Report Inappropriate Content
Sunny T,
you made my day...AGAIN! 
Regards,
Bart
- Mark as New
- Bookmark
- Subscribe
- Mute
- Subscribe to RSS Feed
- Permalink
- Report Inappropriate Content
Just change the Total Expression to be a difference one