Unlock a world of possibilities! Login now and discover the exclusive benefits awaiting you.
- Qlik Community
- :
- All Forums
- :
- QlikView App Dev
- :
- Different data depending on filter
- Subscribe to RSS Feed
- Mark Topic as New
- Mark Topic as Read
- Float this Topic for Current User
- Bookmark
- Subscribe
- Mute
- Printer Friendly Page
- Mark as New
- Bookmark
- Subscribe
- Mute
- Subscribe to RSS Feed
- Permalink
- Report Inappropriate Content
Different data depending on filter
hello,
i have the following data: and i would like depending what i choose on the filter to show different data:
for example:
on segment i should have only segment 1,2 and 3, but i choose the first and second segment the result it has to be 34.
¿can you help me?
| Segment | sum(Clients) |
| 1-2 | 34 |
| 1-3 | 543 |
| 2-3 | 434 |
| 1-2-3 | 342 |
| 1 | 54 |
| 2 | 43 |
| 3 | 654 |
Accepted Solutions
- Mark as New
- Bookmark
- Subscribe
- Mute
- Subscribe to RSS Feed
- Permalink
- Report Inappropriate Content
- Mark as New
- Bookmark
- Subscribe
- Mute
- Subscribe to RSS Feed
- Permalink
- Report Inappropriate Content
hi you can create flags in script like below
aa:
load * Inline [
Segment ,sum(Clients)
1-2 ,34
1-3 ,543
2-3 ,434
1-2-3, 342
1 ,54
2 ,43
3 ,654
];
result:
LOAD * ,
if(Segment='1-2',0) as flag1,
if(Segment,'1-3',1) as flag2,
if(Segment,'1-2-3',2) as flag3
.........like all
Resident aa;
- Mark as New
- Bookmark
- Subscribe
- Mute
- Subscribe to RSS Feed
- Permalink
- Report Inappropriate Content
Hi,
May be like as at attached file?
Regards,
Andrey
- Mark as New
- Bookmark
- Subscribe
- Mute
- Subscribe to RSS Feed
- Permalink
- Report Inappropriate Content
Hi,
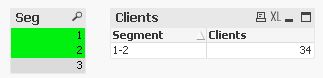
maybe you could use an AND-mode List Box on a subsegment field to achieve this result:
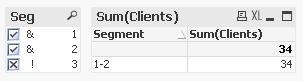
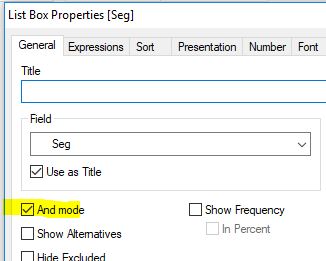
table1:
LOAD Text(Segment) as Segment,
    Clients
inline
[Segment,Clients
1,54
2,43
3,654
1-2,34
1-3,543
2-3,434
1-2-3,342];

tabSegments:
LOAD Distinct
    Segment,
    SubField(Segment,'-') as Seg
Resident table1;
hope this helps
regards
Marco
- Mark as New
- Bookmark
- Subscribe
- Mute
- Subscribe to RSS Feed
- Permalink
- Report Inappropriate Content
Hi,
Try like this,
step1:-
load Distinct *,SubField(Segment,'-') as Segment1 inline [
Segment,Clients
1-2,34
1-2,30
1-3,543
2-3,434
1-2-3,342
1,54
2,43
3,654
];
step2:-
Create one variable like vSeg=if(GetSelectedCount(Segment1)>1,Concat(distinct Segment1,'-'),Segment1)
Segmen1 field take as filter and write exp like,
=sum({<Segment={"$(vSeg)"}>}distinct Clients)
Regards,
- Mark as New
- Bookmark
- Subscribe
- Mute
- Subscribe to RSS Feed
- Permalink
- Report Inappropriate Content
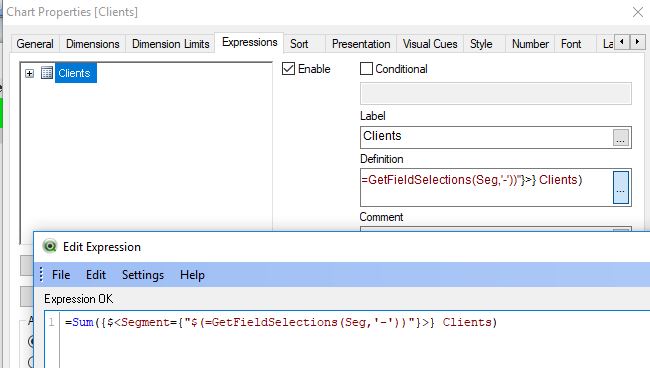
maybe also possible:
regards
Marco