Unlock a world of possibilities! Login now and discover the exclusive benefits awaiting you.
- Qlik Community
- :
- All Forums
- :
- QlikView App Dev
- :
- Re: Dimension Data conditional Format
- Subscribe to RSS Feed
- Mark Topic as New
- Mark Topic as Read
- Float this Topic for Current User
- Bookmark
- Subscribe
- Mute
- Printer Friendly Page
- Mark as New
- Bookmark
- Subscribe
- Mute
- Subscribe to RSS Feed
- Permalink
- Report Inappropriate Content
Dimension Data conditional Format
Hi,
I am trying to change the color of the dimension in a pivot table based on one condition.
Dimension: Period
Value: 2013,2014
Condition:if(2013>2014),Green,Red
Can please let me know
- « Previous Replies
-
- 1
- 2
- Next Replies »
Accepted Solutions
- Mark as New
- Bookmark
- Subscribe
- Mute
- Subscribe to RSS Feed
- Permalink
- Report Inappropriate Content
- Mark as New
- Bookmark
- Subscribe
- Mute
- Subscribe to RSS Feed
- Permalink
- Report Inappropriate Content
Hi Sasi,
When you add dimension, you can see  , you can click on it and will get some more options as -

Click on 'Background Color' option & write condition as -
If(Period='2013',Green(),If(Period='2014',Red()))
It will show color in background.
Hope this will be helpful for you.
--
Regards,
Prashant P Baste
- Mark as New
- Bookmark
- Subscribe
- Mute
- Subscribe to RSS Feed
- Permalink
- Report Inappropriate Content
Hi,
Not based on 2013 and 2013, we have one expression and the condition is 2013 Vs 2014
- Mark as New
- Bookmark
- Subscribe
- Mute
- Subscribe to RSS Feed
- Permalink
- Report Inappropriate Content
Hi,
Can you post sample data?
- Mark as New
- Bookmark
- Subscribe
- Mute
- Subscribe to RSS Feed
- Permalink
- Report Inappropriate Content
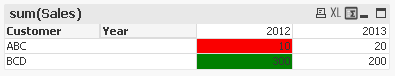
Then same thing you need to do in expression -
In 'Background Color' of expression, you can write the condition as -
=If((Sum({<Year='2013'>}Amount))>=(Sum({<Year='2014'>}Amount)),Green(),Red())
I hope now I have made right assumptions...!
Is this the solution that you were looking at?
--
Regards,
Prashant P Baste
- Mark as New
- Bookmark
- Subscribe
- Mute
- Subscribe to RSS Feed
- Permalink
- Report Inappropriate Content
PFA sample QVW
- Mark as New
- Bookmark
- Subscribe
- Mute
- Subscribe to RSS Feed
- Permalink
- Report Inappropriate Content
Can any one help me out..
- Mark as New
- Bookmark
- Subscribe
- Mute
- Subscribe to RSS Feed
- Permalink
- Report Inappropriate Content
Add the conditional color expression to the dimension Background Color setting instead of that of the chart expression.
talk is cheap, supply exceeds demand
- Mark as New
- Bookmark
- Subscribe
- Mute
- Subscribe to RSS Feed
- Permalink
- Report Inappropriate Content
Hi Sasi,
Check out the below attachment.
- Mark as New
- Bookmark
- Subscribe
- Mute
- Subscribe to RSS Feed
- Permalink
- Report Inappropriate Content
My requirement is
if value of 2013 is > 2014, then that value should be green, similarly wise versa.
- « Previous Replies
-
- 1
- 2
- Next Replies »