Unlock a world of possibilities! Login now and discover the exclusive benefits awaiting you.
- Qlik Community
- :
- All Forums
- :
- QlikView App Dev
- :
- Dimension and totals in pivot table top row
- Subscribe to RSS Feed
- Mark Topic as New
- Mark Topic as Read
- Float this Topic for Current User
- Bookmark
- Subscribe
- Mute
- Printer Friendly Page
- Mark as New
- Bookmark
- Subscribe
- Mute
- Subscribe to RSS Feed
- Permalink
- Report Inappropriate Content
Dimension and totals in pivot table top row
Hi people,
Need some help with the following....
The requirement I have is to display the following pivot table:
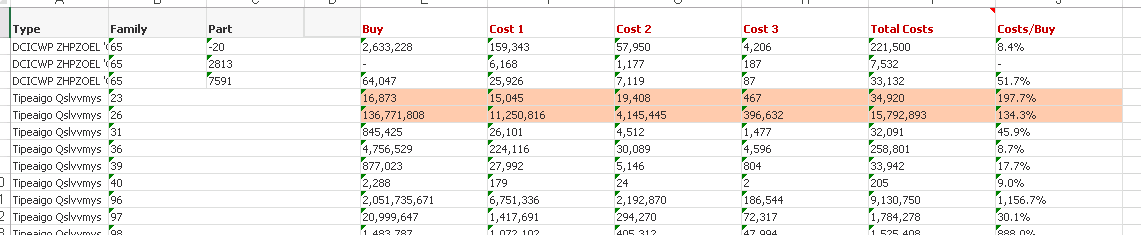
Column E: Buy amount
Columns F,G,H: Costs by type (now only 3, but have to be dynamic)
Column I: Total of Columns F,G,H
Column J: Costs/Buy: Column I/Column E
I created the calculations in the script for every part
The dimension is the report item type
In the table I used one expression:
Pick(Report_PickID, num(sum(CostSummary_Total),'#,##0'),num(avg(CostSummary_Total),'#,##0.0%'))
Report_PickID =1 (sum) for columns E-I and 2 (avg) for J
In the table, the issue we can see is that the Cost/Buy is wrong for the family level (in pink).
Any idea how to resolve this?
Or, is there another way to display dimension total values and grand totals without creating it in the script?
I attached sample data.
Thanks in Advance!
- Mark as New
- Bookmark
- Subscribe
- Mute
- Subscribe to RSS Feed
- Permalink
- Report Inappropriate Content
Found the solution here:
Showing an expression columns at the end of pivot table after Pivoting a dimension
by its.anandrjs