Unlock a world of possibilities! Login now and discover the exclusive benefits awaiting you.
- Qlik Community
- :
- All Forums
- :
- QlikView App Dev
- :
- Re: Dimension in %
Options
- Subscribe to RSS Feed
- Mark Topic as New
- Mark Topic as Read
- Float this Topic for Current User
- Bookmark
- Subscribe
- Mute
- Printer Friendly Page
Turn on suggestions
Auto-suggest helps you quickly narrow down your search results by suggesting possible matches as you type.
Showing results for
Not applicable
2017-06-08
03:45 AM
- Mark as New
- Bookmark
- Subscribe
- Mute
- Subscribe to RSS Feed
- Permalink
- Report Inappropriate Content
Dimension in %
Hi All,
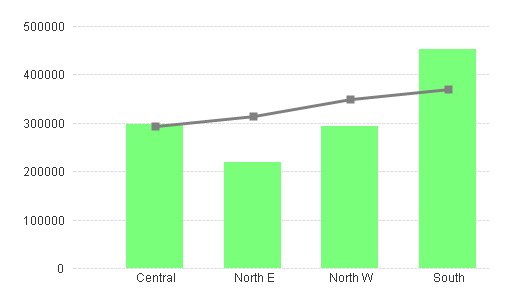
I have following chart which shows comparison. Both are numbers. My requirement is that when used mouse over on line chart's data point, user should see %. % can be calculated from following formula.
Ex: North E has 10 ( green ) & 15 (line chart ) so user should see 150% on line chart.
222 Views
2 Replies
Partner - Master
2017-06-08
04:18 AM
- Mark as New
- Bookmark
- Subscribe
- Mute
- Subscribe to RSS Feed
- Permalink
- Report Inappropriate Content
Hi,
May be marks be on the X axis? Example in the attached file.
Regards,
Andrey
172 Views
Partner - Master II
2017-06-08
04:32 AM
- Mark as New
- Bookmark
- Subscribe
- Mute
- Subscribe to RSS Feed
- Permalink
- Report Inappropriate Content
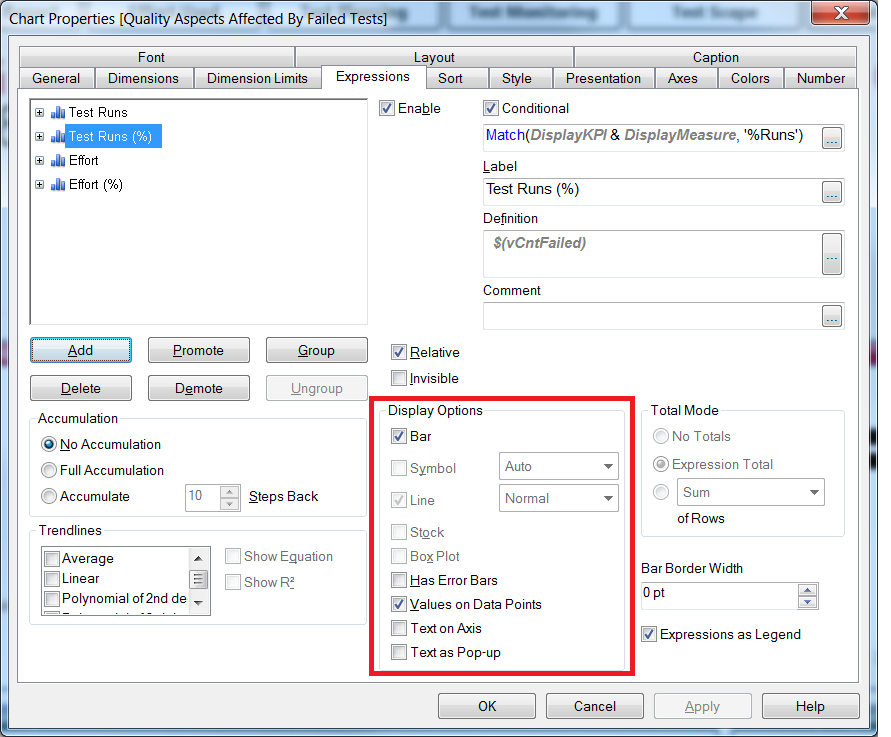
in the expression tab there is a place called Display Options
add the expression for % and put check text as pop up and un-check bar or line
I can walk on water when it freezes
172 Views