Unlock a world of possibilities! Login now and discover the exclusive benefits awaiting you.
- Qlik Community
- :
- All Forums
- :
- QlikView App Dev
- :
- Dimensionality and set analysis
- Subscribe to RSS Feed
- Mark Topic as New
- Mark Topic as Read
- Float this Topic for Current User
- Bookmark
- Subscribe
- Mute
- Printer Friendly Page
- Mark as New
- Bookmark
- Subscribe
- Mute
- Subscribe to RSS Feed
- Permalink
- Report Inappropriate Content
Dimensionality and set analysis
Hi friends,
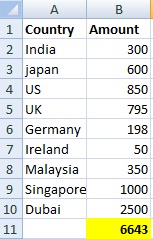
Please help me out in resolving this , I have the data as below in the raw data sheet and need the result as in the result image ,dont know how can that be done using set analysis and dimensionality in qlikview ,kindly help
Raw data :

Result :
the amounts are identified in the ranges as 1 and are finally the amounts are summed at the bottom of the range column and are displayed as below

Kindly hlep me out how can this be possible
sample excel sheet is attached herewith for input source
Kind Regards
Anand
Accepted Solutions
- Mark as New
- Bookmark
- Subscribe
- Mute
- Subscribe to RSS Feed
- Permalink
- Report Inappropriate Content
Hi again Anand,
In my previous reply, I already assumed you would have more than 1 row referring to the same country and thus, added the modified syntax commented in the 3rd expression of the pivot.
Anyways you can find now attached the document with both of your requests.
Check the "presentation" tab (label for totals, multiline settings) and the "visual cues" tab for the changes.
There might be other ways to handle it, hope this one suits you ![]()
- Mark as New
- Bookmark
- Subscribe
- Mute
- Subscribe to RSS Feed
- Permalink
- Report Inappropriate Content
Hello Anand,
Check the attached document.
Hope this helps.
- Mark as New
- Bookmark
- Subscribe
- Mute
- Subscribe to RSS Feed
- Permalink
- Report Inappropriate Content
Hi Anand,
the attached app is not exactly your look and feel, but check it out anyway.
Regards, Roland
- Mark as New
- Bookmark
- Subscribe
- Mute
- Subscribe to RSS Feed
- Permalink
- Report Inappropriate Content
see the attched file and attached Excel
hope this helps
- Mark as New
- Bookmark
- Subscribe
- Mute
- Subscribe to RSS Feed
- Permalink
- Report Inappropriate Content
Cool guys.. Thanks a tonne , it solved my problem to an extent
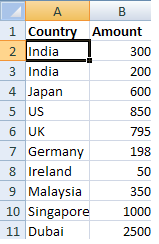
and the current issue was, like if i hav same countries in the source file like in the img attached, the result should be like the way it is in the results page image.

its should sum the amount and should display at the bottom along with an extra row displaying the sum of counts as well
and the two same counties amount should be summed and the count should be 1 instead of 2 and it should fall in the range after summing.

Kindly help guys
- Mark as New
- Bookmark
- Subscribe
- Mute
- Subscribe to RSS Feed
- Permalink
- Report Inappropriate Content
Hi again Anand,
In my previous reply, I already assumed you would have more than 1 row referring to the same country and thus, added the modified syntax commented in the 3rd expression of the pivot.
Anyways you can find now attached the document with both of your requests.
Check the "presentation" tab (label for totals, multiline settings) and the "visual cues" tab for the changes.
There might be other ways to handle it, hope this one suits you ![]()
- Mark as New
- Bookmark
- Subscribe
- Mute
- Subscribe to RSS Feed
- Permalink
- Report Inappropriate Content
Hi bakhache,
It was gr8, thanks a ton, it worked perfectly..............
Thanks Once again !!!
![]()
![]()
cheers
Anand
- Mark as New
- Bookmark
- Subscribe
- Mute
- Subscribe to RSS Feed
- Permalink
- Report Inappropriate Content
You're welcome Anand, I'm glad I could help.
Cheers ![]()