Unlock a world of possibilities! Login now and discover the exclusive benefits awaiting you.
- Qlik Community
- :
- All Forums
- :
- QlikView App Dev
- :
- Re: Display 2 expressions values inside 1 bar
- Subscribe to RSS Feed
- Mark Topic as New
- Mark Topic as Read
- Float this Topic for Current User
- Bookmark
- Subscribe
- Mute
- Printer Friendly Page
- Mark as New
- Bookmark
- Subscribe
- Mute
- Subscribe to RSS Feed
- Permalink
- Report Inappropriate Content
Display 2 expressions values inside 1 bar
Dear Qlikview Experts,
Recently I had received a request from one of my clients to improve the functionality of a bar chart by displaying 2 expression values inside 1 single bar. I was wondering if this is possible to achieve in Qlikview?
Basically right now the bar chart is displaying the % of Goods in a field. On the other hand, clients also want to see the total number of counts for that field to be displayed inside the bar. (The request from the client has been highlighted in RED at the picture below)
I had attached the sample Qlikview file for your reference.
I have no idea whether this is able to achieve in Qlikview, but any ideas from you all would be greatly appreciated! ![]()
Best Regards,
QianNing
Accepted Solutions
- Mark as New
- Bookmark
- Subscribe
- Mute
- Subscribe to RSS Feed
- Permalink
- Report Inappropriate Content
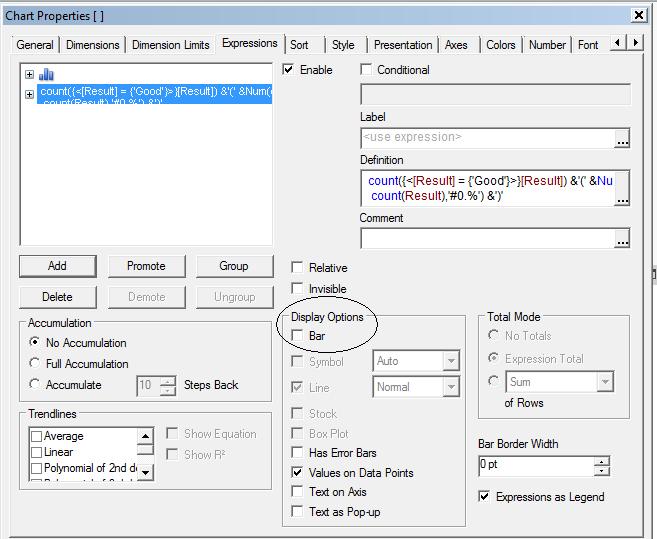
keep your existing expression and uncheck "Values on Data Points" for that expression. Now add one more expression as below:
count({<[Result] = {'Good'}>}[Result]) &'(' &Num(count({<[Result] = {'Good'}>}[Result]) /
count(Result),'#0.%') &')'
make sure you remove the check against bar in "Display options" as show below:

- Mark as New
- Bookmark
- Subscribe
- Mute
- Subscribe to RSS Feed
- Permalink
- Report Inappropriate Content
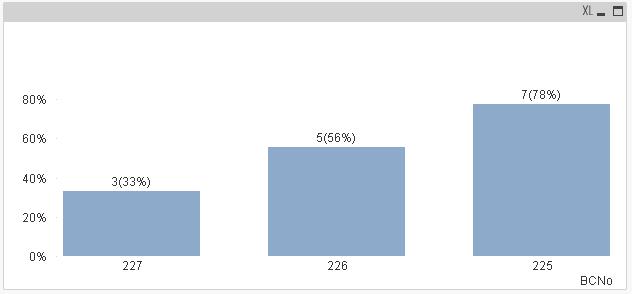
One way you can do is, showing the count and percentage in the brackets on the top of the bar. Take a look at the attached file and hope this helps.
 !
!
- Mark as New
- Bookmark
- Subscribe
- Mute
- Subscribe to RSS Feed
- Permalink
- Report Inappropriate Content
What is the measure for second data points to get 20, 38, 52?? Is this okay?
- Mark as New
- Bookmark
- Subscribe
- Mute
- Subscribe to RSS Feed
- Permalink
- Report Inappropriate Content
Dear Thirumala,
Your ideas looks good and I am willing to take into consideration. May I know more details on how you achieve this outcome? As I was using the Personal Edition, So I am not able to open your qlikview file. Appreciate if you can guide me step by step on how you achieved this outcome. Thanks for your help in advance! ![]()
Best Regards,
QianNing
- Mark as New
- Bookmark
- Subscribe
- Mute
- Subscribe to RSS Feed
- Permalink
- Report Inappropriate Content
Dear Anil,
Your solution looks awesome as well. The measure for second data points will be "count(Result)". As I was using Personal Edition, are you able to provide more with more details on how you did this? ![]()
Best Regards,
QianNing
- Mark as New
- Bookmark
- Subscribe
- Mute
- Subscribe to RSS Feed
- Permalink
- Report Inappropriate Content
keep your existing expression and uncheck "Values on Data Points" for that expression. Now add one more expression as below:
count({<[Result] = {'Good'}>}[Result]) &'(' &Num(count({<[Result] = {'Good'}>}[Result]) /
count(Result),'#0.%') &')'
make sure you remove the check against bar in "Display options" as show below:

- Mark as New
- Bookmark
- Subscribe
- Mute
- Subscribe to RSS Feed
- Permalink
- Report Inappropriate Content
But, Count(Result) returns all 9's only. Anyway i pick Combo chart and attached images for you. Then, Give Dynamic Scale to achieve and one thing we need to know the second expression position should be Right ![]()
- Mark as New
- Bookmark
- Subscribe
- Mute
- Subscribe to RSS Feed
- Permalink
- Report Inappropriate Content
Dear Anil,
I had follow your guides through the picture but still unable to achieve the same outcome as you. Did I miss out anything? ![]()
Best Regards,
QianNing
- Mark as New
- Bookmark
- Subscribe
- Mute
- Subscribe to RSS Feed
- Permalink
- Report Inappropriate Content
Go to axis tab and select Expressions and enable static min/max from scale section
Same for second, But including Position is right
- Mark as New
- Bookmark
- Subscribe
- Mute
- Subscribe to RSS Feed
- Permalink
- Report Inappropriate Content
Dear Thirumala,
Thanks so much for your solution. I think your idea is more closer to the requirement from the client. Appreciated so much for your kind effort! ![]()
Best Regards
QianNing