Unlock a world of possibilities! Login now and discover the exclusive benefits awaiting you.
- Qlik Community
- :
- All Forums
- :
- QlikView App Dev
- :
- Re: Display Fields not related to the Selections
- Subscribe to RSS Feed
- Mark Topic as New
- Mark Topic as Read
- Float this Topic for Current User
- Bookmark
- Subscribe
- Mute
- Printer Friendly Page
- Mark as New
- Bookmark
- Subscribe
- Mute
- Subscribe to RSS Feed
- Permalink
- Report Inappropriate Content
Display Fields not related to the Selections
Hi Qlik Community,
I am currently developing an application that analyzes customer behavior. And part of this analysis is to show customers that does not by a certain product. Right now, I am currently looking for a way on how can I display the list of customers in a straight table that does not buy the selected product in the filter. So far, I've tried using if condition and E() function in Set analysis, however I cannot achieve my desired goal. I know Qlik has the power of gray that displays the unrelated data in the filter colored gray, however, in my actual data, I have so many customers which makes it hard to scroll for the unrelated customers at one glance.
Attached is an excel file containing the Sample Data in the "DATA" sheet and my desired result in "Expect Result" sheet. Also, I have attached my Sample QVW file for the solutions I've tried.
Hope you can help me achieve my goal. Thank you in advance and more power to the Qlik Community! 
- Mark as New
- Bookmark
- Subscribe
- Mute
- Subscribe to RSS Feed
- Permalink
- Report Inappropriate Content
May be this
sum({1<CustomerID=E({<ProductID=P()>})>} Sales)
- Mark as New
- Bookmark
- Subscribe
- Mute
- Subscribe to RSS Feed
- Permalink
- Report Inappropriate Content
Hi Antonio,
I've tried the solution that you provided however it does not generated my expected result.
The result of the set analysis you provided looks like below:
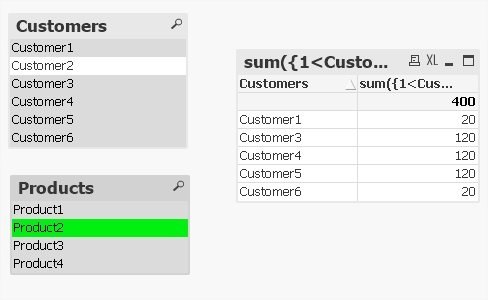

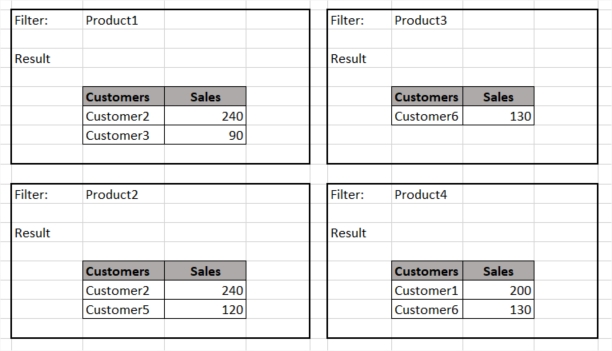
My expected result looks like this:
- Mark as New
- Bookmark
- Subscribe
- Mute
- Subscribe to RSS Feed
- Permalink
- Report Inappropriate Content
Your Data Model isn't correct
- Mark as New
- Bookmark
- Subscribe
- Mute
- Subscribe to RSS Feed
- Permalink
- Report Inappropriate Content
may be try this as calculated dimension
sum( {1-$<Customers = E({1<Products={''}>})>} Sales )
- Mark as New
- Bookmark
- Subscribe
- Mute
- Subscribe to RSS Feed
- Permalink
- Report Inappropriate Content
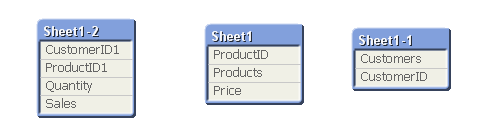
this will help you Connect you data:
LOAD ProductID,
Products,
Price
FROM
(ooxml, embedded labels, header is 1 lines, table is Sheet1);
LOAD Customers,
CustomerID
FROM
(ooxml, embedded labels, header is 1 lines, table is Sheet1);
LOAD CustomerID1 as CustomerID, //add key to customer
ProductID1 as ProductID, //add key to product
Quantity,
Sales
FROM
(ooxml, embedded labels, header is 1 lines, table is Sheet1);
- Mark as New
- Bookmark
- Subscribe
- Mute
- Subscribe to RSS Feed
- Permalink
- Report Inappropriate Content
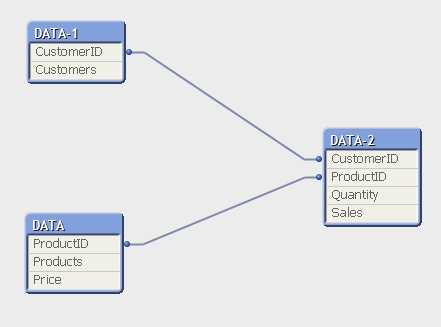
Hi All,
Based on checking, my model is correct. I just don't know why the result from what I've attached has incorrect data set. However, for your reference, here what my model looks like:
Moving forward, just to give an overview regarding my expected result here's what it looks like:
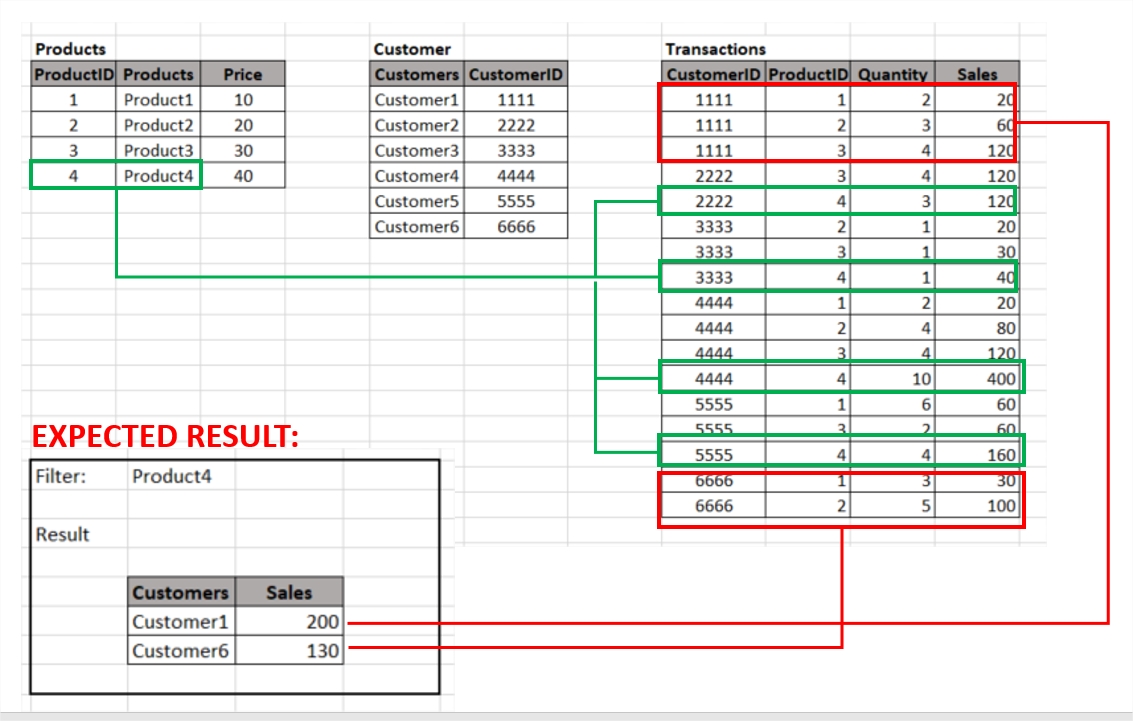
As you can see in the above image, what I want is when I filter Products = "Product4", my result should be Customer1 and Customer6. Because as you can see, in my data, Customer 2, 3, 4, and 5 bought Product 4 while only Customer 1 and 6 did not purchase product 4.
- Mark as New
- Bookmark
- Subscribe
- Mute
- Subscribe to RSS Feed
- Permalink
- Report Inappropriate Content
Hi check this
- Mark as New
- Bookmark
- Subscribe
- Mute
- Subscribe to RSS Feed
- Permalink
- Report Inappropriate Content
My expression should work
- Mark as New
- Bookmark
- Subscribe
- Mute
- Subscribe to RSS Feed
- Permalink
- Report Inappropriate Content
may be try this as calculated dimension
sum( {1-$<Customers = E({1<Products={''}>})>} Sales )