Unlock a world of possibilities! Login now and discover the exclusive benefits awaiting you.
Announcements
FLASH SALE: Save $500! Use code FLASH2026 at checkout until Feb 14th at 11:59PM ET. Register Now!
- Qlik Community
- :
- All Forums
- :
- QlikView App Dev
- :
- Display a Table Box in columns
Options
- Subscribe to RSS Feed
- Mark Topic as New
- Mark Topic as Read
- Float this Topic for Current User
- Bookmark
- Subscribe
- Mute
- Printer Friendly Page
Turn on suggestions
Auto-suggest helps you quickly narrow down your search results by suggesting possible matches as you type.
Showing results for
Not applicable
2014-09-10
07:43 PM
- Mark as New
- Bookmark
- Subscribe
- Mute
- Subscribe to RSS Feed
- Permalink
- Report Inappropriate Content
Display a Table Box in columns
Hi All,
Could you please let me know how I can display the table box (or whatever table/chart type is appropriate) to display such that it shows:
Primary Model | Prospect Model
Right now it's a list box that shows the value in a row. I'd like to have it shown side-by-side, i.e. in a column right next to the dimension name (Primary Model).

Thanks!
Carey
733 Views
1 Solution
Accepted Solutions
Specialist II
2014-09-10
09:50 PM
- Mark as New
- Bookmark
- Subscribe
- Mute
- Subscribe to RSS Feed
- Permalink
- Report Inappropriate Content
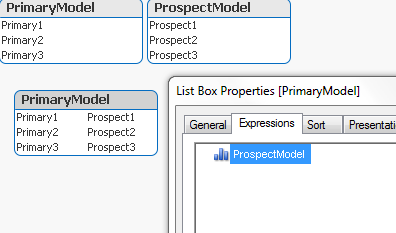
Make a listbox of the Primary Model, switch in listbox properties to the expression tab and insert the prospect model as expression:

664 Views
2 Replies
Specialist II
2014-09-10
09:50 PM
- Mark as New
- Bookmark
- Subscribe
- Mute
- Subscribe to RSS Feed
- Permalink
- Report Inappropriate Content
Make a listbox of the Primary Model, switch in listbox properties to the expression tab and insert the prospect model as expression:

665 Views
Not applicable
2014-09-11
12:18 PM
Author
- Mark as New
- Bookmark
- Subscribe
- Mute
- Subscribe to RSS Feed
- Permalink
- Report Inappropriate Content
Thank you!
664 Views