Unlock a world of possibilities! Login now and discover the exclusive benefits awaiting you.
- Qlik Community
- :
- All Forums
- :
- QlikView App Dev
- :
- Re: Display current fiscal week in barchart
- Subscribe to RSS Feed
- Mark Topic as New
- Mark Topic as Read
- Float this Topic for Current User
- Bookmark
- Subscribe
- Mute
- Printer Friendly Page
- Mark as New
- Bookmark
- Subscribe
- Mute
- Subscribe to RSS Feed
- Permalink
- Report Inappropriate Content
Display current fiscal week in barchart
Hi Everyone,
I have Sold Date, Fiscal week, fiscal month, fiscal year in my data model.
i was trying to plot a bar chart with curretn fiscal week in X-axis and sum(amount) in Y-axis.
If the application gets reloaded tuesday, i need to populate only monday, tuesday of the curretn fiscal week in the x-axis.
Can someone look into this pls.
- Mark as New
- Bookmark
- Subscribe
- Mute
- Subscribe to RSS Feed
- Permalink
- Report Inappropriate Content
Hi Sunny,
Its working with the logic and with the previous logic too.
But i was not able to give labels to the x-axis...
That is the problem.
I'm using Date field as a dimension.
- Mark as New
- Bookmark
- Subscribe
- Mute
- Subscribe to RSS Feed
- Permalink
- Report Inappropriate Content
Label to x-axis? Not sure what you mean Mark?
- Mark as New
- Bookmark
- Subscribe
- Mute
- Subscribe to RSS Feed
- Permalink
- Report Inappropriate Content
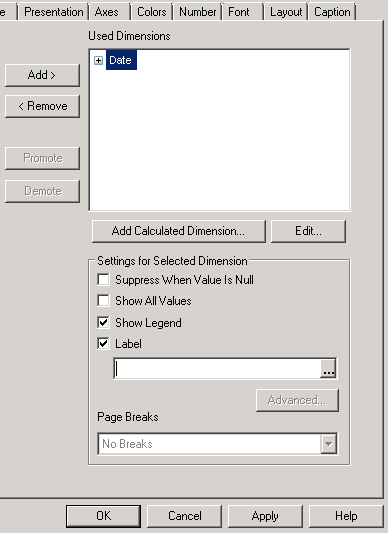
Here is the problem, i have the legend and label enabled...
But no label in X-axis.

- Mark as New
- Bookmark
- Subscribe
- Mute
- Subscribe to RSS Feed
- Permalink
- Report Inappropriate Content

Not able to display the date below every bar.
- Mark as New
- Bookmark
- Subscribe
- Mute
- Subscribe to RSS Feed
- Permalink
- Report Inappropriate Content
Type Date in the below box (the one right below the Label Check box
- Mark as New
- Bookmark
- Subscribe
- Mute
- Subscribe to RSS Feed
- Permalink
- Report Inappropriate Content
I tried that bro.
but not showing anything
- Mark as New
- Bookmark
- Subscribe
- Mute
- Subscribe to RSS Feed
- Permalink
- Report Inappropriate Content
While on the chart press Ctrl + Shift and when you see red lines, drag the one at the bottom little bit upward. Ensure that you have Date written in the label box underneath the Label checkbox.
HTH
Best,
Sunny
- Mark as New
- Bookmark
- Subscribe
- Mute
- Subscribe to RSS Feed
- Permalink
- Report Inappropriate Content
Sunny, i just deleted that chart recreate dnew onhe.
Its working now.
Thanq bro.
![]()
The Saviour....
- Mark as New
- Bookmark
- Subscribe
- Mute
- Subscribe to RSS Feed
- Permalink
- Report Inappropriate Content
Hahaha ya, that is always an option ![]()
I am glad you were able to find a solution. Please close the thread.
Best,
Sunny
- Mark as New
- Bookmark
- Subscribe
- Mute
- Subscribe to RSS Feed
- Permalink
- Report Inappropriate Content
I just realized that you already did close the thread. Thanks Mark.
Best,
Sunny