Unlock a world of possibilities! Login now and discover the exclusive benefits awaiting you.
- Qlik Community
- :
- All Forums
- :
- QlikView App Dev
- :
- Re: Display detail values in summary chart - issue...
- Subscribe to RSS Feed
- Mark Topic as New
- Mark Topic as Read
- Float this Topic for Current User
- Bookmark
- Subscribe
- Mute
- Printer Friendly Page
- Mark as New
- Bookmark
- Subscribe
- Mute
- Subscribe to RSS Feed
- Permalink
- Report Inappropriate Content
Display detail values in summary chart - issue on date
Hi Experts,
I have combo chart with
Dimension as Month and
Expressions are Sum(revenue), Total Customer per day(Need to display as line in this chart)
Scenario
on X- Axis, i want to see All the Months and on Y- axis the bar should represent the Total Revenue by each month. So far it is taken care
The second expression in this chart should be a line and the date as to display the totals of that specific day
Eg:
January Total Revenue is 3000(displays as bar)
The line as to display as a trend for each day
Jan 1 Total 10 customers
Jan 2 Total 9 Customer
Note: January dates are not required to be displayed on the axis tab, instead it should just show Month name and the trending should be as day for the second expression(Total customer).
I am just trying to see if it something possible in QlikView any help would be appreciable.
- « Previous Replies
-
- 1
- 2
- Next Replies »
- Mark as New
- Bookmark
- Subscribe
- Mute
- Subscribe to RSS Feed
- Permalink
- Report Inappropriate Content
Just thinking out loud here: What if you use date as your dimension and make it continuous.
Best,
Sunny
- Mark as New
- Bookmark
- Subscribe
- Mute
- Subscribe to RSS Feed
- Permalink
- Report Inappropriate Content
I tried to make the second expression as (Count of customer- Trending line) When changing the dimension to date instead of month, it is displaying the trend but this is not i want, axis has to display only months with total revenue and customer as trending to day level
Appreciate for your quick response
- Mark as New
- Bookmark
- Subscribe
- Mute
- Subscribe to RSS Feed
- Permalink
- Report Inappropriate Content
Would you be able to share a sample application?
Best,
Sunny
- Mark as New
- Bookmark
- Subscribe
- Mute
- Subscribe to RSS Feed
- Permalink
- Report Inappropriate Content
Attached is the QVW file and data files
I think i have issue on date joins also, Like Date from Summary for Each month (Eg: january) is taking all the months(January, feb..) in detail tab, instead of sing month(Eg: January)
- Mark as New
- Bookmark
- Subscribe
- Mute
- Subscribe to RSS Feed
- Permalink
- Report Inappropriate Content
Are you trying to join like this?
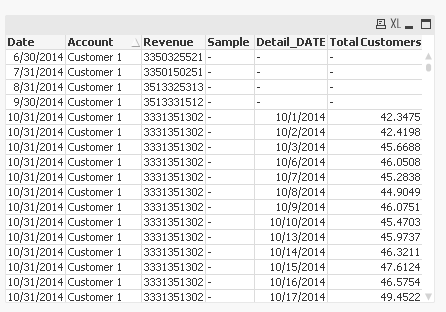
If yes, then use the script like this:
Test:
LOAD Date,
Month(Date) as Month,
Account,
Revenue,
Sample
FROM
Summary.xlsx
(ooxml, embedded labels, table is Sheet1);
Join(Test)
LOAD Detail_DATE,
Month(Detail_DATE) as Month,
[Total Customers],
Account
FROM
Detail.xlsx
(ooxml, embedded labels, table is Sheet1);
- Mark as New
- Bookmark
- Subscribe
- Mute
- Subscribe to RSS Feed
- Permalink
- Report Inappropriate Content
Sunny,
Thanks for the Join resolutions, but coming to my main question, do you think there is solution for this
- Mark as New
- Bookmark
- Subscribe
- Mute
- Subscribe to RSS Feed
- Permalink
- Report Inappropriate Content
Working on that right now. 
Best,
Sunny
- Mark as New
- Bookmark
- Subscribe
- Mute
- Subscribe to RSS Feed
- Permalink
- Report Inappropriate Content
Look at this, does this make sense? PFA
Best,
Sunny
- Mark as New
- Bookmark
- Subscribe
- Mute
- Subscribe to RSS Feed
- Permalink
- Report Inappropriate Content
Sunny,
It works but is there any way on x-axis you could change the date to month name(Eg: jan2015), when tried the trending is disappering
- « Previous Replies
-
- 1
- 2
- Next Replies »