Unlock a world of possibilities! Login now and discover the exclusive benefits awaiting you.
- Qlik Community
- :
- All Forums
- :
- QlikView App Dev
- :
- Display different value on hover
- Subscribe to RSS Feed
- Mark Topic as New
- Mark Topic as Read
- Float this Topic for Current User
- Bookmark
- Subscribe
- Mute
- Printer Friendly Page
- Mark as New
- Bookmark
- Subscribe
- Mute
- Subscribe to RSS Feed
- Permalink
- Report Inappropriate Content
Display different value on hover
Hello,
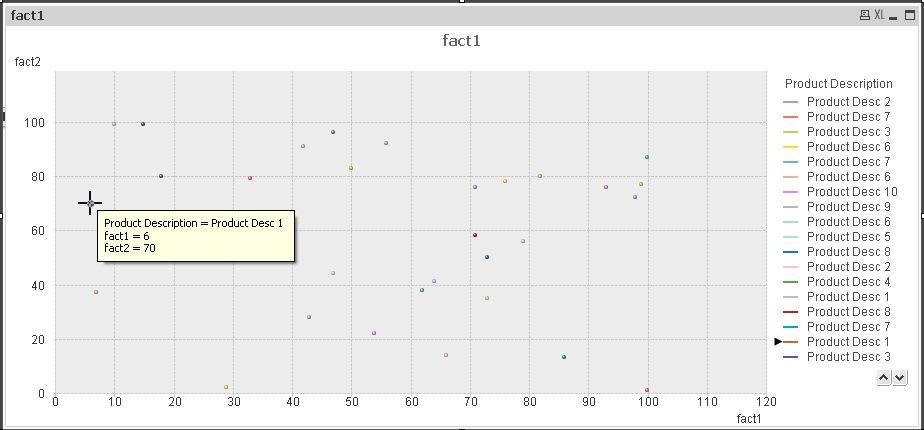
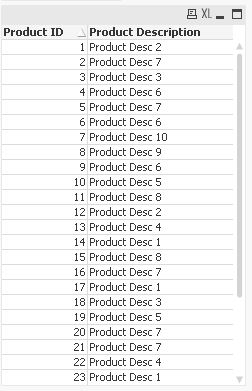
I have a scatter chart where I have plotted Product IDs. However, when you hover over the points, I would like to have the Product Description display, rather than the Product IDs. I have to plot IDs over Descriptions because the relationship is not 1-1.
Any ideas on how to do this?
Thank you,
Mel
Accepted Solutions
- Mark as New
- Bookmark
- Subscribe
- Mute
- Subscribe to RSS Feed
- Permalink
- Report Inappropriate Content
Hi,
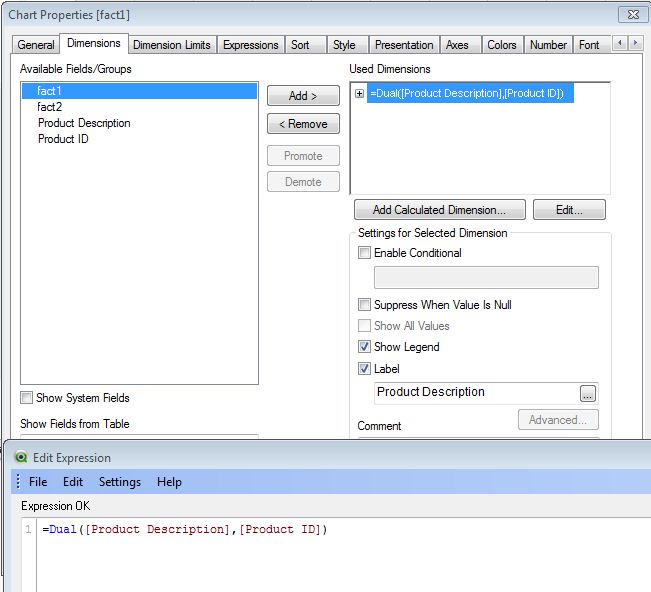
another solution could be a calculated dimension that generates dual values (Product ID (if numerical) formated as Product description):
=Dual([Product Description],[Product ID])
Using the Product description directly as the first dimension would require it to e unique like the Procuct ID.
Otherwise the bubble count and positions could change.
hope this helps
regards
Marco
- Mark as New
- Bookmark
- Subscribe
- Mute
- Subscribe to RSS Feed
- Permalink
- Report Inappropriate Content
You can try adding another expression " ='Product Description : ' & [Product Description] " and tick Text as Pop-up
- Mark as New
- Bookmark
- Subscribe
- Mute
- Subscribe to RSS Feed
- Permalink
- Report Inappropriate Content
Keep in mind, the third expression dictates the bubble size, so you would want to add it after that
- Mark as New
- Bookmark
- Subscribe
- Mute
- Subscribe to RSS Feed
- Permalink
- Report Inappropriate Content
You can also add Product Description as first Dimension
- Mark as New
- Bookmark
- Subscribe
- Mute
- Subscribe to RSS Feed
- Permalink
- Report Inappropriate Content
Hi,
another solution could be a calculated dimension that generates dual values (Product ID (if numerical) formated as Product description):
=Dual([Product Description],[Product ID])
Using the Product description directly as the first dimension would require it to e unique like the Procuct ID.
Otherwise the bubble count and positions could change.
hope this helps
regards
Marco