Unlock a world of possibilities! Login now and discover the exclusive benefits awaiting you.
- Qlik Community
- :
- All Forums
- :
- QlikView App Dev
- :
- Display every value of a field in a combo chart
- Subscribe to RSS Feed
- Mark Topic as New
- Mark Topic as Read
- Float this Topic for Current User
- Bookmark
- Subscribe
- Mute
- Printer Friendly Page
- Mark as New
- Bookmark
- Subscribe
- Mute
- Subscribe to RSS Feed
- Permalink
- Report Inappropriate Content
Display every value of a field in a combo chart
Hi everybody,
i have the following situation:
I am using a combo chart with the dimension age and an expression avg(salary). The result is a chart that displays for every value of the field age an average salary (as seen below).
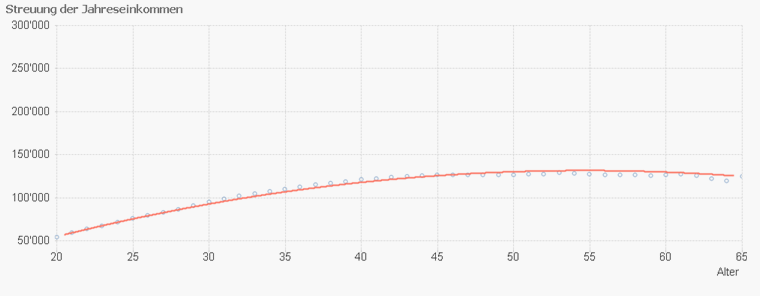
But my goal is to display every value of the field salary as a point in the combo chart combined with a polynomial of 2nd degree. I have tried different and/or several expressions but none of that was of success.
Can you help me?
Kind regards,
Markus
Accepted Solutions
- Mark as New
- Bookmark
- Subscribe
- Mute
- Subscribe to RSS Feed
- Permalink
- Report Inappropriate Content
Hi Markus
Maybe use a scatter chart with
dimension : yourIdfield
expression 1 : sum( Age)
expression 2 : Avg(Salary)
Then create a trendline with 2nd degree polynom
JJ
- Mark as New
- Bookmark
- Subscribe
- Mute
- Subscribe to RSS Feed
- Permalink
- Report Inappropriate Content
Hi Markus
Maybe use a scatter chart with
dimension : yourIdfield
expression 1 : sum( Age)
expression 2 : Avg(Salary)
Then create a trendline with 2nd degree polynom
JJ
- Mark as New
- Bookmark
- Subscribe
- Mute
- Subscribe to RSS Feed
- Permalink
- Report Inappropriate Content
Hi JJ
Thanks, it works that way!
Markus