Unlock a world of possibilities! Login now and discover the exclusive benefits awaiting you.
- Qlik Community
- :
- All Forums
- :
- QlikView App Dev
- :
- Re: Display graph dynamically
- Subscribe to RSS Feed
- Mark Topic as New
- Mark Topic as Read
- Float this Topic for Current User
- Bookmark
- Subscribe
- Mute
- Printer Friendly Page
- Mark as New
- Bookmark
- Subscribe
- Mute
- Subscribe to RSS Feed
- Permalink
- Report Inappropriate Content
Display graph dynamically
Hello everyone,
I need help for something quite complicated.
I want to know if it is possible to display dynamically several graph according to a dimension.
For exemple, display this :
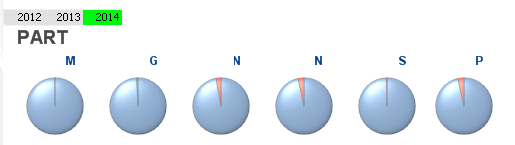
If in my dimension I have "M, G, N, S, P" (sorry for the double N).
And, if one day I have a new field called Z that appear in my database, a new graph Z will be displayed.
In cognos, we can do this with a container, but I don't know if it is possible with Qlik ?
Thanks 
Accepted Solutions
- Mark as New
- Bookmark
- Subscribe
- Mute
- Subscribe to RSS Feed
- Permalink
- Report Inappropriate Content
Hi Olivier,
You can achieve this by using a trellis chart.
A trellis chart takes one dimension and displays multiple charts for all the values of that dimension. You can find the trellis in -
New Sheet Object -> Chart -> Pie Chart -> Dimensions tab. Similarly you should find the Trellis option on the other charts as well.
Hope this helps.
Regards,
SK
- Mark as New
- Bookmark
- Subscribe
- Mute
- Subscribe to RSS Feed
- Permalink
- Report Inappropriate Content
Thanks lot !