Unlock a world of possibilities! Login now and discover the exclusive benefits awaiting you.
- Qlik Community
- :
- All Forums
- :
- QlikView App Dev
- :
- Re: Display last value in range instead of total
- Subscribe to RSS Feed
- Mark Topic as New
- Mark Topic as Read
- Float this Topic for Current User
- Bookmark
- Subscribe
- Mute
- Printer Friendly Page
- Mark as New
- Bookmark
- Subscribe
- Mute
- Subscribe to RSS Feed
- Permalink
- Report Inappropriate Content
Display last value in range instead of total
Hi All,
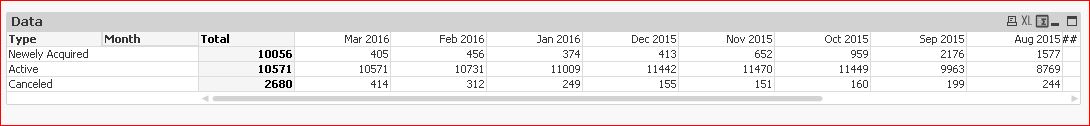
I have a pivot table that represents number of donors by segment and month (see the attachment).
On this pivot table for Active donors in total I want to display the last Month Value instead of total.
Is it possible? Please Help.
Thanks
- « Previous Replies
- Next Replies »
- Mark as New
- Bookmark
- Subscribe
- Mute
- Subscribe to RSS Feed
- Permalink
- Report Inappropriate Content
Try with dimensionality function. . Like
If (dimensionality ()=1 and donorsfield='Active',
Sum ({<Month={"=$(max (month))"}>}value), your general expression )
- Mark as New
- Bookmark
- Subscribe
- Mute
- Subscribe to RSS Feed
- Permalink
- Report Inappropriate Content
Hi Denis,
I assume three fields, Month, Type and Data (the value).
The expression to do it had two parts:
a) differentiate on whether it is a normal or total value.
I had two options:
If(SecondaryDimensionality()=1, Month Calc, Total Calc )
OR
If(Count(Distinct Month)=1, Month Calc, Total Calc ).
Either works, but secondarydimensionality() may be an issue if pivot to put Month on the vertical axis instead of horizontal.
Month Calc was simply Sum(Data).
Total Calc I had two methods after playing around:
a) Sum(If(Month = $(=Max(Month)),Data)).
This calculates Max(Month) based on selections at the document level and then only includes the Month based on that, which will always be the last month.
b) Sum(Aggr(If(Only(Month) = Max(Total <Type> Month),Sum(Data)),Month,Type)).
Similar method but checks for the Max month within the chart, rather than the document.
Hopefully this helps.
- Mark as New
- Bookmark
- Subscribe
- Mute
- Subscribe to RSS Feed
- Permalink
- Report Inappropriate Content
Hi Settu,
Thanks for replay,
It still does not display lust Month data in a total.
- Mark as New
- Bookmark
- Subscribe
- Mute
- Subscribe to RSS Feed
- Permalink
- Report Inappropriate Content
Hi Michael,
Thanks for replay.
I am afraid that I do not clearly understand your formula.
Currently I have one dimension - Month in my pivot table and the Active donor expression (see below)
Count({<FiscalYear = {'$(=maxstring(FiscalYear))'},[Gift Type] = {[Recurring Gift Pay-Cash]}, DonorCurentSegment = {'Active'}>} Distinct [Constituent ID]).
Could you kindly explain how I can insert my formula into yours?
Thanks
- Mark as New
- Bookmark
- Subscribe
- Mute
- Subscribe to RSS Feed
- Permalink
- Report Inappropriate Content
Check the Attachment
- Mark as New
- Bookmark
- Subscribe
- Mute
- Subscribe to RSS Feed
- Permalink
- Report Inappropriate Content
Hi Settu,
Thank you for replay.
Unfortunately I am using personal version of Qlikview as my company just planning to launch it, so I cannot open your file.
- Mark as New
- Bookmark
- Subscribe
- Mute
- Subscribe to RSS Feed
- Permalink
- Report Inappropriate Content
That is fine. in the pivot table try this expression
=if(Dimensionality()=1 and SecondaryDimensionality()=0 and Type='Active',sum({<Month={"$(=MonthName(Max(Month)))"}>}Data),sum(Data))
I assumed, month field would be like Apr 2016, May 2016... Mar 2015
- Mark as New
- Bookmark
- Subscribe
- Mute
- Subscribe to RSS Feed
- Permalink
- Report Inappropriate Content
If(SecondaryDimensionality()=1,
Count({<FiscalYear = {'$(=maxstring(FiscalYear))'},[Gift Type] = {[Recurring Gift Pay-Cash]}, DonorCurentSegment = {'Active'}>} Distinct [Constituent ID]),
Count({<FiscalYear = {'$(=maxstring(FiscalYear))'},[Gift Type] = {[Recurring Gift Pay-Cash]}, DonorCurentSegment = {'Active'}, Month = {$(=Max(Month))}>} Distinct [Constituent ID] ) )
)
I'm not sure what your Month field is called, so substitute that in. I went with the SecondaryDimensionality() which identifies whether it's a data or subtotal column. Risky if switch Month to rows though, but can add the Dimensionality() function also to test for both.
- Mark as New
- Bookmark
- Subscribe
- Mute
- Subscribe to RSS Feed
- Permalink
- Report Inappropriate Content
Hi Settu,
I tried unfortunately it did not work.
My month field is Month like April, May,....
The month filed is the only dimension I am using all the others are calculated.
Below is the formula I am using to get the Active donors numbers:
Count({<FiscalYear = {'$(=maxstring(FiscalYear))'},[Gift Type] = {[Recurring Gift Pay-Cash]}, DonorCurentSegment = {'Active'}>} Distinct [Constituent ID]).
Please let me know if you have any ideas.
Thanks a lot for your help.
- « Previous Replies
- Next Replies »