Unlock a world of possibilities! Login now and discover the exclusive benefits awaiting you.
- Qlik Community
- :
- All Forums
- :
- QlikView App Dev
- :
- Re: Display rows as columns and viceversa using Sc...
- Subscribe to RSS Feed
- Mark Topic as New
- Mark Topic as Read
- Float this Topic for Current User
- Bookmark
- Subscribe
- Mute
- Printer Friendly Page
- Mark as New
- Bookmark
- Subscribe
- Mute
- Subscribe to RSS Feed
- Permalink
- Report Inappropriate Content
Display rows as columns and viceversa using Script
Hi all,
I am loading data from QVD's and the user wants the values to be displayed in columns rather than in rows which happens in traditional tables. For example,
Table:(Current)
Country Code Sales
America USA 2000
Australia Aus 2500
Germany Gmy 3000
Should be displayed as
Table:(Expected)
Country America Australia Germany
Code USA Aus Gmy
Sales 2000 2500 3000
and this has to be done only in the script not in visualization. I've tried crosstable, transpose function but nothing helped me completely.
- « Previous Replies
-
- 1
- 2
- Next Replies »
- Mark as New
- Bookmark
- Subscribe
- Mute
- Subscribe to RSS Feed
- Permalink
- Report Inappropriate Content
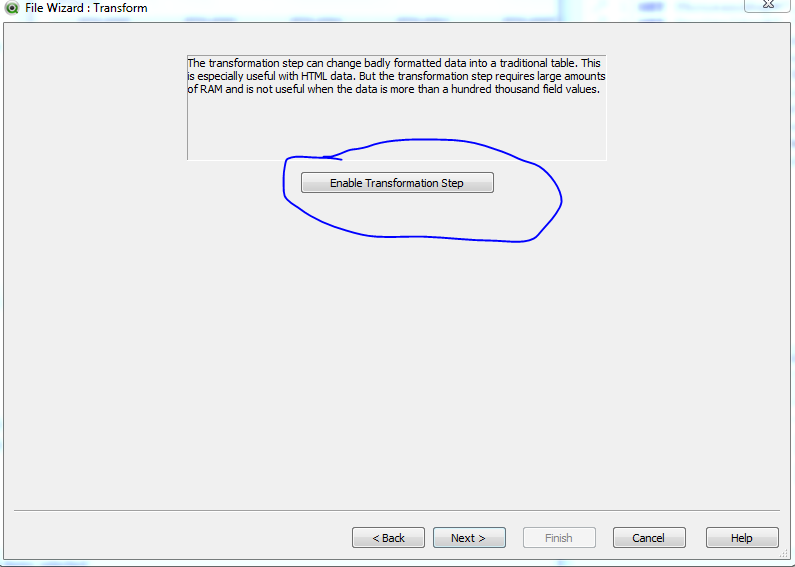
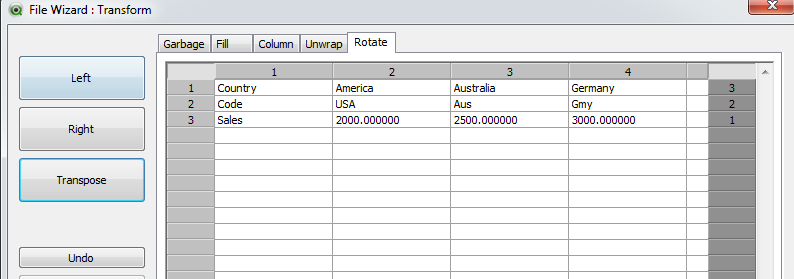
Use transpose functionality:
Step 1:
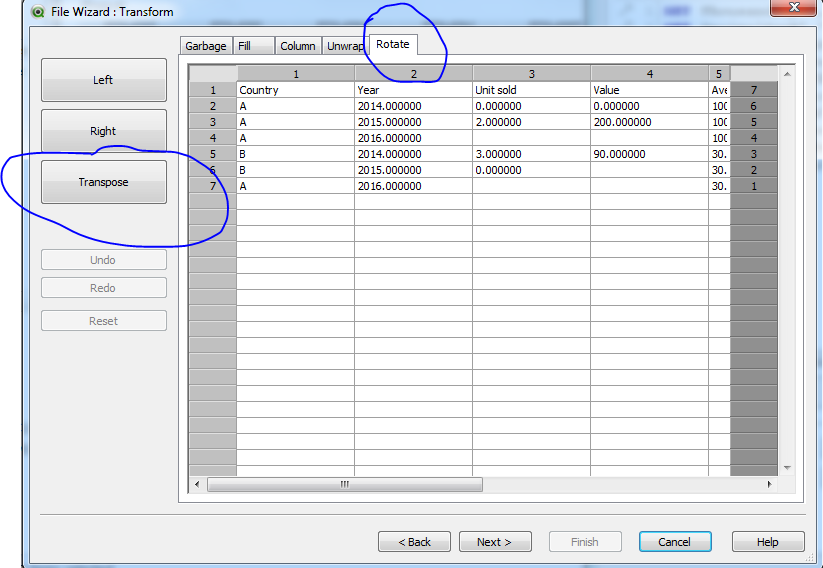
Step 2:
- Mark as New
- Bookmark
- Subscribe
- Mute
- Subscribe to RSS Feed
- Permalink
- Report Inappropriate Content
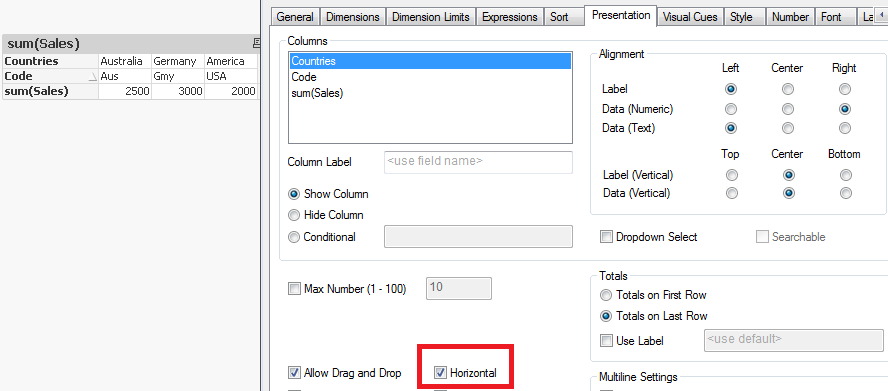
you can use a straight table in horizontal display mode as displayed below. It will be in the UI.
- Mark as New
- Bookmark
- Subscribe
- Mute
- Subscribe to RSS Feed
- Permalink
- Report Inappropriate Content
Hi Sunny,
Thank you for the quick response. I have tried your method before posting the question, it is not showing the fieldnames, just the values like below
@1 @2 @3
America Australia Germany
USA Aus Gmy
2000 2500 3000
also when a selection is made using listboxes like for example: Code= USA,
I am getting the result as
@1 @2 @3
USA Aus Gmy
When it should show like
@1
America
USA
2000
- Mark as New
- Bookmark
- Subscribe
- Mute
- Subscribe to RSS Feed
- Permalink
- Report Inappropriate Content
Hi Sudeep,
Thank you for the suggestion, but I need it using only the script not in UI as I am working on a datamodel.
- Mark as New
- Bookmark
- Subscribe
- Mute
- Subscribe to RSS Feed
- Permalink
- Report Inappropriate Content
Before:
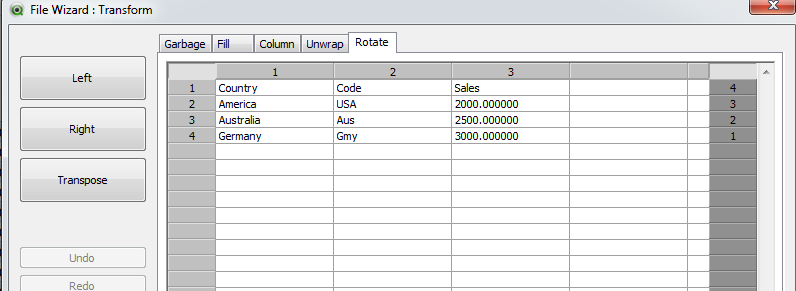
After:
Script:
Table:
LOAD Country,
America,
Australia,
Germany
FROM
Community_180203.xlsx
(ooxml, embedded labels, table is Sheet1, filters(
Transpose()
));
- Mark as New
- Bookmark
- Subscribe
- Mute
- Subscribe to RSS Feed
- Permalink
- Report Inappropriate Content
Hi Sunny,
I have a question. Is it the same when loading from a qvd, because that is where I am loading the actual data and also the question posted is just for reference and not the exact one, so I have given only 3 fields and 3 values each. The original ones contain n number of values for each field. How to perform what you said in this case?
While loading using qvd, I am not getting the field names in enable transformation step.
- Mark as New
- Bookmark
- Subscribe
- Mute
- Subscribe to RSS Feed
- Permalink
- Report Inappropriate Content
I am sure it should be available, but I can test it real quick
- Mark as New
- Bookmark
- Subscribe
- Mute
- Subscribe to RSS Feed
- Permalink
- Report Inappropriate Content
It seems possible to Transpose a QVD.
- Mark as New
- Bookmark
- Subscribe
- Mute
- Subscribe to RSS Feed
- Permalink
- Report Inappropriate Content
Please, that might help me get the solution.
- « Previous Replies
-
- 1
- 2
- Next Replies »