Unlock a world of possibilities! Login now and discover the exclusive benefits awaiting you.
- Qlik Community
- :
- All Forums
- :
- QlikView App Dev
- :
- Re: Display sum of calculated column in each cell ...
- Subscribe to RSS Feed
- Mark Topic as New
- Mark Topic as Read
- Float this Topic for Current User
- Bookmark
- Subscribe
- Mute
- Printer Friendly Page
- Mark as New
- Bookmark
- Subscribe
- Mute
- Subscribe to RSS Feed
- Permalink
- Report Inappropriate Content
Display sum of calculated column in each cell of column
Hi All,
I am having a little trouble getting the sum value of a field and am hoping someone may have come across something similar.
I have a pivot table that has a number of calculated fields (each feeding off the previous). I am trying to create a new column that sums the values of one column if they are not negative numbers.
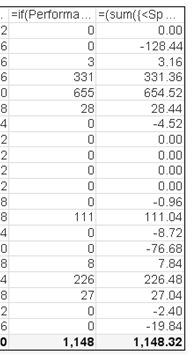
I have managed to show the positive values and turn all negative ones to 0 through an if statement but the expression total still shows the value as if the negative values remain (1st column).

The statement I am using is as follows
=if(Performance-
if(Code = '06T', sum({<Code2 -= {'INCOM92%'}>} [<18]),
sum({<Code2 -= {'INCOM92%'}>}[<18])*max(Excl06T)) < 0, 0,
Performance-
if(Code = '06T', sum({<Code2 -= {'INCOM92%'}>} [<18]),
sum({<Code2 -= {'INCOM92%'}>}[<18])*max(Excl06T)))
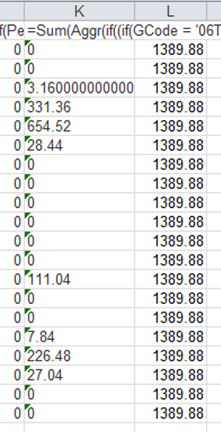
Is there a way that I can get the total value of only the positive values to be shown in the column for each row (so 1389.88 in each cell)
Any help you can offer is greatly appreciated.
- « Previous Replies
-
- 1
- 2
- Next Replies »
Accepted Solutions
- Mark as New
- Bookmark
- Subscribe
- Mute
- Subscribe to RSS Feed
- Permalink
- Report Inappropriate Content
Then all you need is this
=Sum(TOTAL Aggr(if((if(GCode = '06T', sum({<Code2 -= {'INCOM92%'}>}RTTotal), sum({<Code2 -= {'INCOM92%'}>}RTTotal)*max(Excl06T)) * 0.92)-
if(GCode = '06T', sum({<Code2 -= {'INCOM92%'}>} [<18]),
sum({<Code2 -= {'INCOM92%'}>}[<18])*max(Excl06T)) < 0, 0,
(if(GCode = '06T', sum({<Code2 -= {'INCOM92%'}>}RTTotal), sum({<Code2 -= {'INCOM92%'}>}RTTotal)*max(Excl06T)) * 0.92)-
if(GCode = '06T', sum({<Code2 -= {'INCOM92%'}>} [<18]),
sum({<Code2 -= {'INCOM92%'}>}[<18])*max(Excl06T)))
,GCode, Code2))
- Mark as New
- Bookmark
- Subscribe
- Mute
- Subscribe to RSS Feed
- Permalink
- Report Inappropriate Content
Try this
Sum(Aggr(
if(Performance-
if(Code = '06T', sum({<Code2 -= {'INCOM92%'}>} [<18]),
sum({<Code2 -= {'INCOM92%'}>}[<18])*max(Excl06T)) < 0, 0,
Performance-
if(Code = '06T', sum({<Code2 -= {'INCOM92%'}>} [<18]),
sum({<Code2 -= {'INCOM92%'}>}[<18])*max(Excl06T))),
YourDimension/s))
Also, look here
- Mark as New
- Bookmark
- Subscribe
- Mute
- Subscribe to RSS Feed
- Permalink
- Report Inappropriate Content
Hi Sunny,
I've tried the
Sum(Aggr(
if(Performance-
if(Code = '06T', sum({<Code2 -= {'INCOM92%'}>} [<18]),
sum({<Code2 -= {'INCOM92%'}>}[<18])*max(Excl06T)) < 0, 0,
Performance-
if(Code = '06T', sum({<Code2 -= {'INCOM92%'}>} [<18]),
sum({<Code2 -= {'INCOM92%'}>}[<18])*max(Excl06T))),
YourDimension/s))
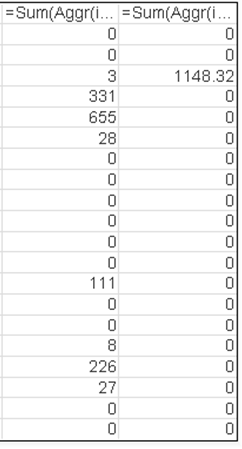
But this just makes everything 0
I will have a look at the links you provided and feed back
Thank you.
- Mark as New
- Bookmark
- Subscribe
- Mute
- Subscribe to RSS Feed
- Permalink
- Report Inappropriate Content
Did you replace the work YourDimension/s with you chart dimensions or did you just copy paste what I gave you above ![]()
- Mark as New
- Bookmark
- Subscribe
- Mute
- Subscribe to RSS Feed
- Permalink
- Report Inappropriate Content
Hi Sunny,
I've probably confused you a little here. I did replace the 'YourDimension/s' with my actual dimensions but to no avail.
- Mark as New
- Bookmark
- Subscribe
- Mute
- Subscribe to RSS Feed
- Permalink
- Report Inappropriate Content
That should have worked... I am not sure what might have been missing. Also, did you check the two links I shared? If even those didn't help, would you be able to share a sample?
- Mark as New
- Bookmark
- Subscribe
- Mute
- Subscribe to RSS Feed
- Permalink
- Report Inappropriate Content
Hi Sunny,
I had a look through the links but neither seemed to give me an answer to this issue.
Please find attached an example of what I am trying to do. the final column in the table is the one I am trying to display the total value of all positive numbers from the 'Number of Fines' column.
Thank you so much for your help with this, I just can't see where I'm going wrong.
Jarrad
- Mark as New
- Bookmark
- Subscribe
- Mute
- Subscribe to RSS Feed
- Permalink
- Report Inappropriate Content
You had column name reference in your expression.... Aggr() is unable to take Column label reference... try this
=Sum(Aggr(if((if(GCode = '06T', sum({<Code2 -= {'INCOM92%'}>}RTTotal), sum({<Code2 -= {'INCOM92%'}>}RTTotal)*max(Excl06T)) * 0.92)-
if(GCode = '06T', sum({<Code2 -= {'INCOM92%'}>} [<18]),
sum({<Code2 -= {'INCOM92%'}>}[<18])*max(Excl06T)) < 0, 0,
(if(GCode = '06T', sum({<Code2 -= {'INCOM92%'}>}RTTotal), sum({<Code2 -= {'INCOM92%'}>}RTTotal)*max(Excl06T)) * 0.92)-
if(GCode = '06T', sum({<Code2 -= {'INCOM92%'}>} [<18]),
sum({<Code2 -= {'INCOM92%'}>}[<18])*max(Excl06T)))
,GCode, Code2))
- Mark as New
- Bookmark
- Subscribe
- Mute
- Subscribe to RSS Feed
- Permalink
- Report Inappropriate Content
Hi Sunny,
Thanks for this, unfortunately this puts me back in the same position I started in. What I am trying to achieve is the following;

The second column is the total of all the positive values within the previous column ('Number of Fines').
If I take the second dimension out of the aggregate function it will sum everything regardless of value and only display it in one cell.

Is there a way to display the 1,389.88 in all of the cells not just the one (this is filtered to Apr in the months).
Sorry, I think I've not been explaining myself properly.
- Mark as New
- Bookmark
- Subscribe
- Mute
- Subscribe to RSS Feed
- Permalink
- Report Inappropriate Content
Then all you need is this
=Sum(TOTAL Aggr(if((if(GCode = '06T', sum({<Code2 -= {'INCOM92%'}>}RTTotal), sum({<Code2 -= {'INCOM92%'}>}RTTotal)*max(Excl06T)) * 0.92)-
if(GCode = '06T', sum({<Code2 -= {'INCOM92%'}>} [<18]),
sum({<Code2 -= {'INCOM92%'}>}[<18])*max(Excl06T)) < 0, 0,
(if(GCode = '06T', sum({<Code2 -= {'INCOM92%'}>}RTTotal), sum({<Code2 -= {'INCOM92%'}>}RTTotal)*max(Excl06T)) * 0.92)-
if(GCode = '06T', sum({<Code2 -= {'INCOM92%'}>} [<18]),
sum({<Code2 -= {'INCOM92%'}>}[<18])*max(Excl06T)))
,GCode, Code2))
- « Previous Replies
-
- 1
- 2
- Next Replies »