Unlock a world of possibilities! Login now and discover the exclusive benefits awaiting you.
- Qlik Community
- :
- All Forums
- :
- QlikView App Dev
- :
- Re: Display text label for expression in a bar cha...
- Subscribe to RSS Feed
- Mark Topic as New
- Mark Topic as Read
- Float this Topic for Current User
- Bookmark
- Subscribe
- Mute
- Printer Friendly Page
- Mark as New
- Bookmark
- Subscribe
- Mute
- Subscribe to RSS Feed
- Permalink
- Report Inappropriate Content
Display text label for expression in a bar chart
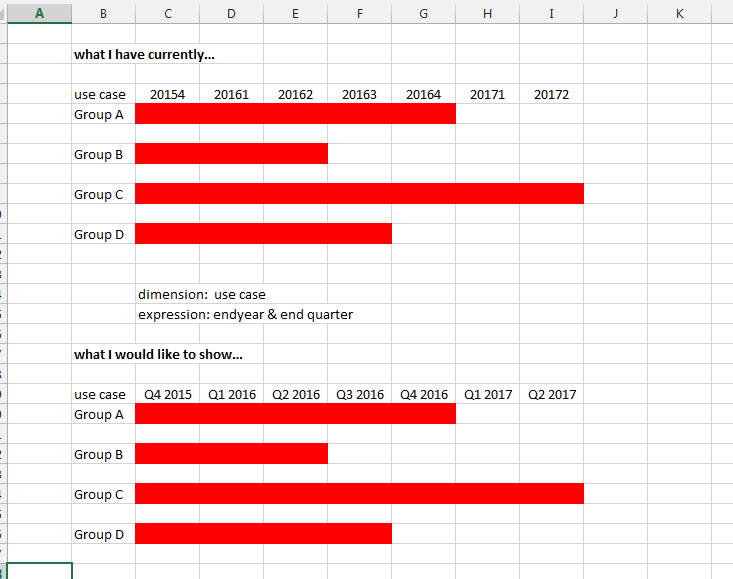
Newbie question here. I have a simple bar chart that shows the use cases (dimension) by quarter/year. I can successfully get the basics of the chart the way the user wants by using the year concatenated with quarter as my expression, but the expression labels then shows as '20171' for example whereas I would like to show it as 'Q1 2017'. Is this possible?
- Tags:
- new_to_qlikview
- Mark as New
- Bookmark
- Subscribe
- Mute
- Subscribe to RSS Feed
- Permalink
- Report Inappropriate Content
Try this as the expression for label:
'Q' & Month(Date) & ' ' & Year(Date)
'Q' & Ceil(Month(Date)/3) & ' ' & Year(Date)
- Mark as New
- Bookmark
- Subscribe
- Mute
- Subscribe to RSS Feed
- Permalink
- Report Inappropriate Content
='Q'& QuarterField & ' ' & YearField
- Mark as New
- Bookmark
- Subscribe
- Mute
- Subscribe to RSS Feed
- Permalink
- Report Inappropriate Content
I must be doing something wrong as I tried that previously (and again now), and my chart just shows 'No data to display' when I use that as my expression.
Here's a visual of what I have and what I'm going for.

- Mark as New
- Bookmark
- Subscribe
- Mute
- Subscribe to RSS Feed
- Permalink
- Report Inappropriate Content
May be try this as your calculated dimension instead of [use case]:
Dual('Q' & Right([use case], 1) & ' ' & Left([use case], 4), [use case])
- Mark as New
- Bookmark
- Subscribe
- Mute
- Subscribe to RSS Feed
- Permalink
- Report Inappropriate Content
Missed that you are using an expression.
I don't think you will easily get a text representation at y-axis, but for mouse over, you can try
=Dual( 'Q'& QuarterField & ' ' & YearField, Makedate(YearField, QuarterField*3-2) )
- Mark as New
- Bookmark
- Subscribe
- Mute
- Subscribe to RSS Feed
- Permalink
- Report Inappropriate Content
What should work is using a an expression that returns a date:
=Makedate(YearField, QuarterField*3-2)
Then set the number format in Number tab to date and use some format code like MMM YYYY
No format code for quarters, AFAIK.
- Mark as New
- Bookmark
- Subscribe
- Mute
- Subscribe to RSS Feed
- Permalink
- Report Inappropriate Content
So it is pretty limited it appears. Thanks swuehl, I will use your suggestions to get a little closer to what they wanted.