Unlock a world of possibilities! Login now and discover the exclusive benefits awaiting you.
- Qlik Community
- :
- All Forums
- :
- QlikView App Dev
- :
- Re: Displaying last 12 months in a Chart
- Subscribe to RSS Feed
- Mark Topic as New
- Mark Topic as Read
- Float this Topic for Current User
- Bookmark
- Subscribe
- Mute
- Printer Friendly Page
- Mark as New
- Bookmark
- Subscribe
- Mute
- Subscribe to RSS Feed
- Permalink
- Report Inappropriate Content
Displaying last 12 months in a Chart
Hello,
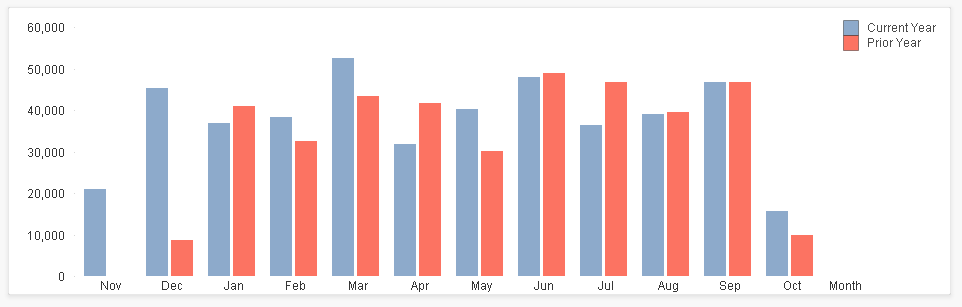
I am looking for some help on restricting a chart to display the recent 12 month's data. Chart looks like the attachment and the set expressions are pasted below.
Dimension:
=Month(MakeDate(2015,FISC_MTH_NBR)) // FISC_MTH_NBR is the Fiscal equivalent of a month
Expressions:
Num(Sum({<FISC_YR_NBR={"$(=Only({1}YearofToday))"},DateNum={">=$(=Num(FISC_YR_START_DT))<=$(=Num(Today()))"}>} PRICE),'#,###,###,##0') // YearofToday is a variable defined at the Script level which is if(Date=Today(),FISC_YR_NBR) as YearofToday
I have 4 of such expressions which will display the Revenue and Margin for Current and Prior Years.
The solutions/suggestions already discussed in the community will not help me as i am not using the date column in my expressions.
Thanks.
- « Previous Replies
-
- 1
- 2
- Next Replies »
- Mark as New
- Bookmark
- Subscribe
- Mute
- Subscribe to RSS Feed
- Permalink
- Report Inappropriate Content
Hello Sunny,
Current Year
1) 10/13/2015 to 10/13/2016 - This is my requirement
2) 01/01/2016 to 10/13/2016
Previous Year
1) 10/13/2014 to 10/13/2015 - This is my requirement
2) 01/01/2015 to 12/31/2015
So that we compare the same period across different years. And then bars are for months with the current month as the right most bar.
Please let me know if you need more information..
Thanks.
- Mark as New
- Bookmark
- Subscribe
- Mute
- Subscribe to RSS Feed
- Permalink
- Report Inappropriate Content
This?
- « Previous Replies
-
- 1
- 2
- Next Replies »