Unlock a world of possibilities! Login now and discover the exclusive benefits awaiting you.
- Qlik Community
- :
- All Forums
- :
- QlikView App Dev
- :
- Displaying negetive percentage values as (##%)
- Subscribe to RSS Feed
- Mark Topic as New
- Mark Topic as Read
- Float this Topic for Current User
- Bookmark
- Subscribe
- Mute
- Printer Friendly Page
- Mark as New
- Bookmark
- Subscribe
- Mute
- Subscribe to RSS Feed
- Permalink
- Report Inappropriate Content
Displaying negetive percentage values as (##%)
Hello all,
I need to display negative percentage values in the chart in the (##%) format (as (5%), (10%) instead of -5%, -10%).
Here is the default QV formatting:
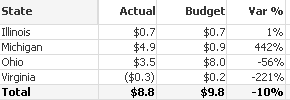
using the '#,##0%' format string
I thought displaying negative percentage values in parenthesis should be a trivial task and I've updated the chart with the following format string '#,##0%;(#,##0%)'.
As a result values are displayed like:
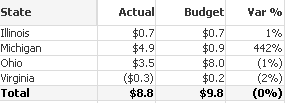
I am not 100% sure how QV is using this format string, but it looks like it doubles "Show in percent %" option and divides values by 100 one more time (for negative values only).
I was hoping somebody have more elegant solution instead of using (Var *100) option for negative values in my Expression....
The closest one I've found is to use the '#,##0%;(#,##0)%' format string (% sign outside the parenthesis).
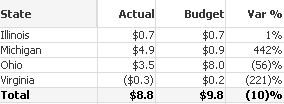
This display format is a bit un-orthodox, but at least the values are correct.
Any other solutions/suggestions? I would appreciate a feedback.
Best regards,
Vladimir
- « Previous Replies
-
- 1
- 2
- Next Replies »
- Mark as New
- Bookmark
- Subscribe
- Mute
- Subscribe to RSS Feed
- Permalink
- Report Inappropriate Content
Hi
Actually I came across this discussion. What I found that the simplest solution is to multiply the value in the expression and use the following text in the format: #,##0.0% ;(#,##0.0%) (Notice the space before the semicolon).
Qlikview treats the format as a percentage if it is the last character in the format.
For example
NUM((SUM(profit)/SUM(amount) -1) * 100, '#,##0.0% ;(#,##0.0%)')
The only problem I see here if this exported into Excel, it appears without percent sign or if you use the format as a setting, it shows like 25,00%.
Cheers
Darius
- Mark as New
- Bookmark
- Subscribe
- Mute
- Subscribe to RSS Feed
- Permalink
- Report Inappropriate Content
Darius,
Thank you for reply. This solution will not work well in my case (I am using variables as expressions, which actually integrated into other charts, so multiplying all values by 100 creates few problems). And the full export functionality (with proper formatting) is critical for me as well.
Thanks for suggestion.
Regards,
Vladimir
- Mark as New
- Bookmark
- Subscribe
- Mute
- Subscribe to RSS Feed
- Permalink
- Report Inappropriate Content
Thanks for your idea @Darius Pranskus
- « Previous Replies
-
- 1
- 2
- Next Replies »