Unlock a world of possibilities! Login now and discover the exclusive benefits awaiting you.
- Qlik Community
- :
- All Forums
- :
- QlikView App Dev
- :
- Displaying the Percentage of Values from the total...
- Subscribe to RSS Feed
- Mark Topic as New
- Mark Topic as Read
- Float this Topic for Current User
- Bookmark
- Subscribe
- Mute
- Printer Friendly Page
- Mark as New
- Bookmark
- Subscribe
- Mute
- Subscribe to RSS Feed
- Permalink
- Report Inappropriate Content
Displaying the Percentage of Values from the total of Value based on section of range
Hi All,
I been posed with a requirement where the client wants to see the percentage of the values for the selected range to the total Value.
For Example the client the client wants to see the value percentage of top 10 suppliers spend to the total spend.
I defined a slider to define the supplier range whether it is top 10 or 15 or 20 the total need to reflected accrodingly to the selection.
Please help me in finding a solution for this.
Thanks
Surendra Kumar Chunduri
hicdvqlikviewgwassenaar jagan qliklearnScripting App Development seebach stephen-x.redmond tresesco massimo.morelli miguel.angel
- « Previous Replies
-
- 1
- 2
- Next Replies »
Accepted Solutions
- Mark as New
- Bookmark
- Subscribe
- Mute
- Subscribe to RSS Feed
- Permalink
- Report Inappropriate Content
- Mark as New
- Bookmark
- Subscribe
- Mute
- Subscribe to RSS Feed
- Permalink
- Report Inappropriate Content
Hi,
see attachment.
Regards,
Antonio
- Mark as New
- Bookmark
- Subscribe
- Mute
- Subscribe to RSS Feed
- Permalink
- Report Inappropriate Content
Hi,
Attach some sample file.
Regards,
Jagan.
- Mark as New
- Bookmark
- Subscribe
- Mute
- Subscribe to RSS Feed
- Permalink
- Report Inappropriate Content
Attached the Sample File in the Main Post.
Thnaks
- Mark as New
- Bookmark
- Subscribe
- Mute
- Subscribe to RSS Feed
- Permalink
- Report Inappropriate Content
Hi Antonio,
Thanks for the quick answer.
i will check if i can use the same function for a stacked bar chart.
- Mark as New
- Bookmark
- Subscribe
- Mute
- Subscribe to RSS Feed
- Permalink
- Report Inappropriate Content
Hi Surendra,
Uncheck Dimension Limits option, and use below as expression
=If(Rank(sum(spend)) <=Vtop, Sum(spend)) / Sum(TOTAL spend)
Hope this helps you.
Regards,
Jagan.
- Mark as New
- Bookmark
- Subscribe
- Mute
- Subscribe to RSS Feed
- Permalink
- Report Inappropriate Content
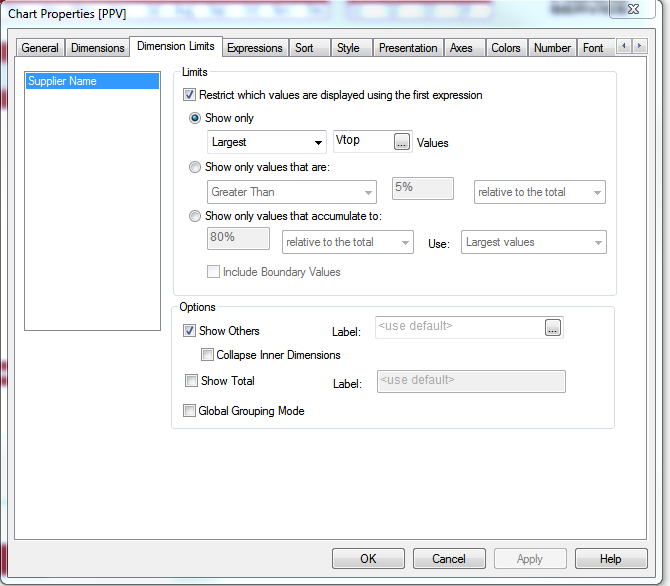
Hi Jagan, Where can I find Dimension Limits option?
- Mark as New
- Bookmark
- Subscribe
- Mute
- Subscribe to RSS Feed
- Permalink
- Report Inappropriate Content
Hi,
It is in Chart Properties > Dimension Limits
Regards,
Jagan.
- Mark as New
- Bookmark
- Subscribe
- Mute
- Subscribe to RSS Feed
- Permalink
- Report Inappropriate Content
- Mark as New
- Bookmark
- Subscribe
- Mute
- Subscribe to RSS Feed
- Permalink
- Report Inappropriate Content
Thank you Jagan and KN.
- « Previous Replies
-
- 1
- 2
- Next Replies »