Unlock a world of possibilities! Login now and discover the exclusive benefits awaiting you.
- Qlik Community
- :
- All Forums
- :
- QlikView App Dev
- :
- Distinct Count Issue
- Subscribe to RSS Feed
- Mark Topic as New
- Mark Topic as Read
- Float this Topic for Current User
- Bookmark
- Subscribe
- Mute
- Printer Friendly Page
- Mark as New
- Bookmark
- Subscribe
- Mute
- Subscribe to RSS Feed
- Permalink
- Report Inappropriate Content
Distinct Count Issue
Hi All,
In one line my requirement is I want to get something like this:
Count (*)
from
(select distinct OrderNumber,OrderLine
from Table);
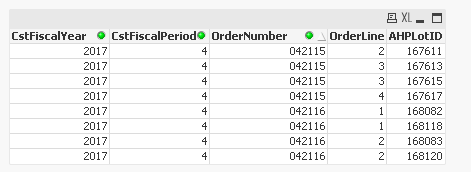
If you check above pic. I have Two Order no : 042115 and 042116.
For 042115, the distinct count OrderLine = 3 and
for 042116, the distinct count OrderLine = 2.
So in count I need 3+2. and I want plot only this count in Separate Bar Chart.
Could anyone please help me to get this.
Thanks,
Sarif
- « Previous Replies
-
- 1
- 2
- Next Replies »
Accepted Solutions
- Mark as New
- Bookmark
- Subscribe
- Mute
- Subscribe to RSS Feed
- Permalink
- Report Inappropriate Content
How can I make the Set Expression.
May be this
Sum(Aggr(Count({<AHPLotID = {"=Count(AHPLotID) > 0"}>} Distinct OrderLine), OrderNumber))
Note: I request you to mark as helpful and close this thread by flag of Vishwarath Answer.
- Mark as New
- Bookmark
- Subscribe
- Mute
- Subscribe to RSS Feed
- Permalink
- Report Inappropriate Content
Add a expression like
count(DISTINCT AHPLotID) that should work for you
- Mark as New
- Bookmark
- Subscribe
- Mute
- Subscribe to RSS Feed
- Permalink
- Report Inappropriate Content
No Avinash... it will give me 8. Not 5.
- Mark as New
- Bookmark
- Subscribe
- Mute
- Subscribe to RSS Feed
- Permalink
- Report Inappropriate Content
remove the AHPLotID column
- Mark as New
- Bookmark
- Subscribe
- Mute
- Subscribe to RSS Feed
- Permalink
- Report Inappropriate Content
Hi Avinash,
I need this in single KPI, like Text Box. So I guess we need to handle in expression.
Please help.
Thanks,
Sarif
- Mark as New
- Bookmark
- Subscribe
- Mute
- Subscribe to RSS Feed
- Permalink
- Report Inappropriate Content
May be this?
Aggr(Count(DISTINCT OrderLine), OrderNumber)
- Mark as New
- Bookmark
- Subscribe
- Mute
- Subscribe to RSS Feed
- Permalink
- Report Inappropriate Content
share the sample app let me check your data set and get back to you
- Mark as New
- Bookmark
- Subscribe
- Mute
- Subscribe to RSS Feed
- Permalink
- Report Inappropriate Content
Hello Anil,
This is not returning anything.
Please help.
Thanks,
Sarif
- Mark as New
- Bookmark
- Subscribe
- Mute
- Subscribe to RSS Feed
- Permalink
- Report Inappropriate Content
Try this in text box may be?
= Sum(Aggr(Count(Distinct OrderLine), OrderNo))
- Mark as New
- Bookmark
- Subscribe
- Mute
- Subscribe to RSS Feed
- Permalink
- Report Inappropriate Content
Check this then
Sum(Aggr(Count(Distinct OrderLine), OrderNumber))
- « Previous Replies
-
- 1
- 2
- Next Replies »