Unlock a world of possibilities! Login now and discover the exclusive benefits awaiting you.
- Qlik Community
- :
- All Forums
- :
- QlikView App Dev
- :
- Distribution normal
- Subscribe to RSS Feed
- Mark Topic as New
- Mark Topic as Read
- Float this Topic for Current User
- Bookmark
- Subscribe
- Mute
- Printer Friendly Page
- Mark as New
- Bookmark
- Subscribe
- Mute
- Subscribe to RSS Feed
- Permalink
- Report Inappropriate Content
Distribution normal
Hello everybody,
I have a question about the normal distribution.
I can not get a chart completly simetric what it is the usual in this kind of chart:
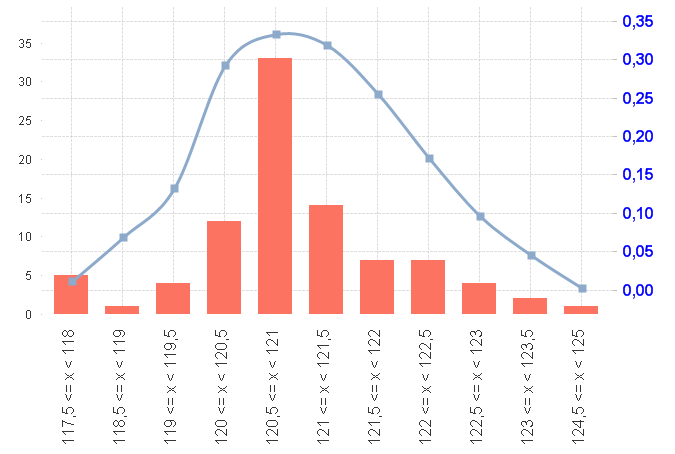
The formuls are:
Dimensions: class([Net Weight Roll Control (gr)],0.5)
Expressions:
normdist( (floor(Min([Net Weight Roll Control (gr)]),0.5)+Ceil(Min([Net Weight Roll Control (gr)]),0.5))/2,
avg({1} total {<[Net Weight Roll Control (gr)]={">0"}>} [Net Weight Roll Control (gr)]),
stdev({1} total {<[Net Weight Roll Control (gr)]={">0"}>} [Net Weight Roll Control (gr)]),0)
Count({<[Net Weight Roll Control (gr)]={">0"}>}[Net Weight Roll Control (gr)])
What I try with: floor(Min([Net Weight Roll Control (gr)]),0.5)+Ceil(Min([Net Weight Roll Control (gr)]),0.5))/2 is to fix the medium of each interval to draw the distribution. In theory, it must be simetric, but follows the form got in the frecuency formul.
I attached the excell file.
Please, don´t send me the answer in qlik examples, because i have edition personal.
Thanks in advance
- Mark as New
- Bookmark
- Subscribe
- Mute
- Subscribe to RSS Feed
- Permalink
- Report Inappropriate Content
That's because your x-axis is not continuous. Have a close look to the intervals shown at the axis, you'll notice that some intermediate intervals are missing (e.g.118 - 118.5).
If you use a continuous axis on axis tab, the curve should look much more as you expect it.
- Mark as New
- Bookmark
- Subscribe
- Mute
- Subscribe to RSS Feed
- Permalink
- Report Inappropriate Content
Using swuehl recomendation
- Mark as New
- Bookmark
- Subscribe
- Mute
- Subscribe to RSS Feed
- Permalink
- Report Inappropriate Content
Hi Clever:
But I am usign Persoanl Edition, therefore I can not open the file.
Could you explain what is your solution with formuls?
Thanks in advance
- Mark as New
- Bookmark
- Subscribe
- Mute
- Subscribe to RSS Feed
- Permalink
- Report Inappropriate Content
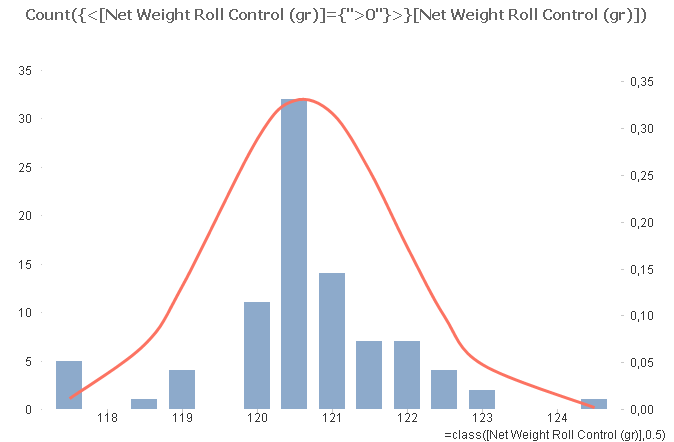
I´ve used an expression (and marked as Line/Smooth)
normdist( (floor(Min([Net Weight Roll Control (gr)]),0.5)+Ceil(Min([Net Weight Roll Control (gr)]),0.5))/2,
avg({1} total {<[Net Weight Roll Control (gr)]={">0"}>} [Net Weight Roll Control (gr)]),
stdev({1} total {<[Net Weight Roll Control (gr)]={">0"}>} [Net Weight Roll Control (gr)]),0)
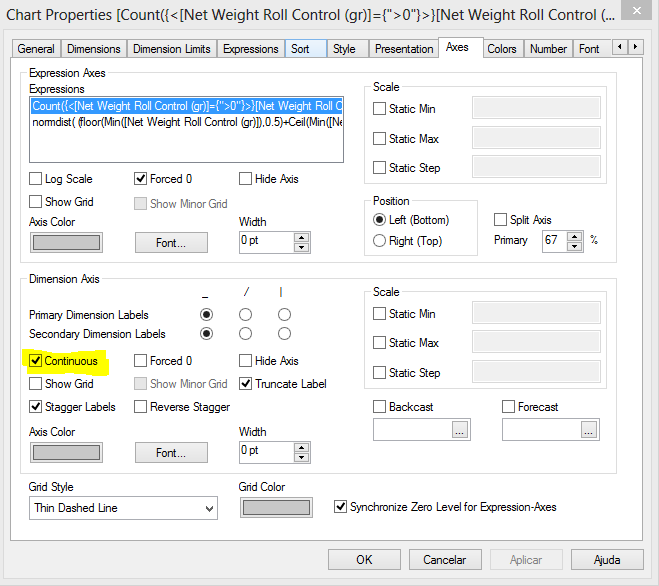
I marked "continuous" into Axes Tab
- Mark as New
- Bookmark
- Subscribe
- Mute
- Subscribe to RSS Feed
- Permalink
- Report Inappropriate Content
normdist( Count({<[Net Weight Roll Control (gr)]={">0"}>}[Net Weight Roll Control (gr)]),
avg({1} total {<[Net Weight Roll Control (gr)]={">0"}>} [Net Weight Roll Control (gr)]),
stdev({1} total {<[Net Weight Roll Control (gr)]={">0"}>} [Net Weight Roll Control (gr)]),0)
gives almost the same curve
- Mark as New
- Bookmark
- Subscribe
- Mute
- Subscribe to RSS Feed
- Permalink
- Report Inappropriate Content
Hi Clever:
Thanks for your answer but the chart is not completely simetric. I have attached your chart and my chart where is more evident:
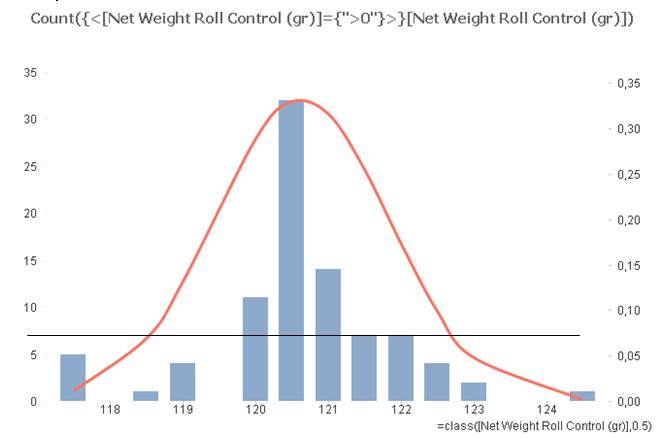
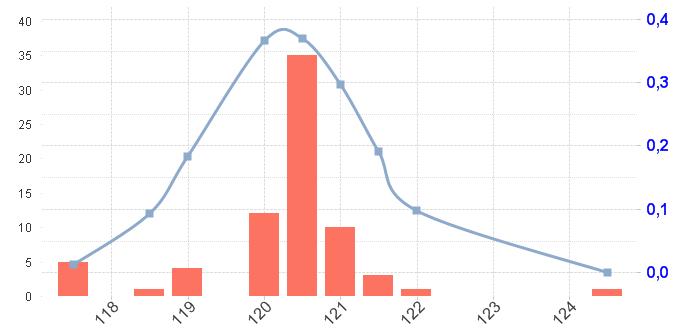
The problem is the lack of values in the midle of the intervals.
For solving this problem is necessary to solve this lack.
Any answer more?
Thanks in advance,
- Mark as New
- Bookmark
- Subscribe
- Mute
- Subscribe to RSS Feed
- Permalink
- Report Inappropriate Content
I think you won't necessarily get a perfect symmetric curve because you are using discrete sampling points.
You can get a smoother, more symmetric curve if you create additional dimension values so your line curve gets calculated for more sampling points:
// Script to read your data and create a complete range of dimension values (adapt 115 start value and 20 sampling
// points to your range
LOAD class(115+recno()/2,0.5) as Class
AutoGenerate 20;
LOAD [Net Weight Roll Control (gr)],
class([Net Weight Roll Control (gr)],0.5) as Class
FROM
[Net Values Weight.xlsx]
(ooxml, embedded labels, table is Sheet1);
Then use a dimension Class and as expression for the line
=normdist( Class,
avg({1} total {<[Net Weight Roll Control (gr)]={">0"}>} [Net Weight Roll Control (gr)]),
stdev({1} total {<[Net Weight Roll Control (gr)]={">0"}>} [Net Weight Roll Control (gr)]),0)