Unlock a world of possibilities! Login now and discover the exclusive benefits awaiting you.
- Qlik Community
- :
- All Forums
- :
- QlikView App Dev
- :
- Dynamic Dimension or Expression based on GetPossib...
- Subscribe to RSS Feed
- Mark Topic as New
- Mark Topic as Read
- Float this Topic for Current User
- Bookmark
- Subscribe
- Mute
- Printer Friendly Page
- Mark as New
- Bookmark
- Subscribe
- Mute
- Subscribe to RSS Feed
- Permalink
- Report Inappropriate Content
Dynamic Dimension or Expression based on GetPossibleCount
I have a major App where I have a chart that I want analysis on Stock Items that are on Special.
Specials are created in the source data, sometimes there is a single item, and sometimes there are multiple items. When there are multiple items, usually they are the same type of item, but just different colours.
I want to create a chart that has 1 row per Special, per Region. There are 6 Regions. If there is only 1 Special, then the chart will only have 6 rows. If there are 2 Specials, then the chart will have 12 rows etc.
If the Special only has 1 Stock Item then I want the data in the cell under the Heading 'Barcode' to be the actual Barcode, however, if the Special has more than 1 Stock Item, then I want the data in the cell under the Heading "Barcode' to be hard coded to the word 'Various'.
If there are multiple Specials in the same chart, then the ones with 1 Stock Item should have the Barcode, and the ones with more than 1 Stock Item should have 'Various'. All in the same chart.
This can be a Calculated Dimension or and Expression - whichever works.
Accepted Solutions
- Mark as New
- Bookmark
- Subscribe
- Mute
- Subscribe to RSS Feed
- Permalink
- Report Inappropriate Content
- Mark as New
- Bookmark
- Subscribe
- Mute
- Subscribe to RSS Feed
- Permalink
- Report Inappropriate Content
Something like this

Dimension
Region
Expressions
If(Count({<hasSpecial = {'1'}>}Barcode) > 1, 'Various', Barcode)
Sum({<hasSpecial = {'1'}>}Amount)
- Mark as New
- Bookmark
- Subscribe
- Mute
- Subscribe to RSS Feed
- Permalink
- Report Inappropriate Content
What happens with no selections? I need all Specials in the chart.
- Mark as New
- Bookmark
- Subscribe
- Mute
- Subscribe to RSS Feed
- Permalink
- Report Inappropriate Content
I see this without selections
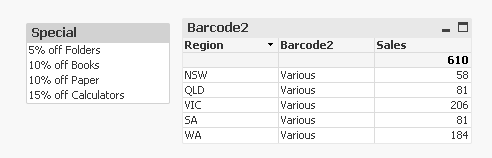
Selection was made to show that if there is only one Barcode, it will show up as the Barcode number rather than Various 
- Mark as New
- Bookmark
- Subscribe
- Mute
- Subscribe to RSS Feed
- Permalink
- Report Inappropriate Content
There should be up to 4 rows per Region, 1 for each Special. Maximum 24 Row, based on Sales. If the Special has only 1 Stock Item, it should show the Barcode. If the Special has more than 1 Stock Item it should show 'Various' but the Sales should be for all Stock Items within that Special.
- Mark as New
- Bookmark
- Subscribe
- Mute
- Subscribe to RSS Feed
- Permalink
- Report Inappropriate Content
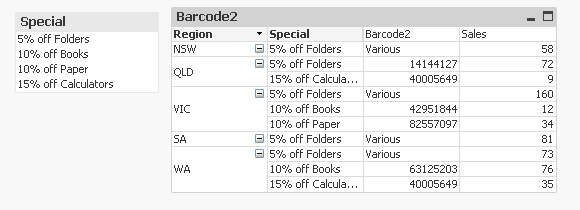
Like this?
- Mark as New
- Bookmark
- Subscribe
- Mute
- Subscribe to RSS Feed
- Permalink
- Report Inappropriate Content
Yes, but I'm not doing a pivot table, and I don't want to see the Special Dimension.
- Mark as New
- Bookmark
- Subscribe
- Mute
- Subscribe to RSS Feed
- Permalink
- Report Inappropriate Content
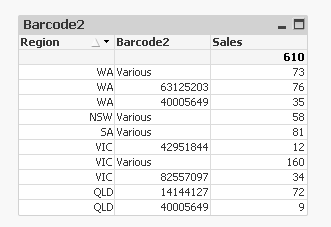
This?
- Mark as New
- Bookmark
- Subscribe
- Mute
- Subscribe to RSS Feed
- Permalink
- Report Inappropriate Content
That's looking good. What's the Expression?
- Mark as New
- Bookmark
- Subscribe
- Mute
- Subscribe to RSS Feed
- Permalink
- Report Inappropriate Content
Dimension
=Dual(Region, Aggr(Rank(TOTAL Special&Region), Region, Special))
Expression
If(Count({<hasSpecial = {'1'}>}Barcode) > 1, 'Various', Barcode)
Sum({<hasSpecial = {'1'}>}Amount)
I have also attached the sample qvw with my previous response