Unlock a world of possibilities! Login now and discover the exclusive benefits awaiting you.
- Qlik Community
- :
- All Forums
- :
- QlikView App Dev
- :
- Re: Dynamic label expression as column name in lin...
- Subscribe to RSS Feed
- Mark Topic as New
- Mark Topic as Read
- Float this Topic for Current User
- Bookmark
- Subscribe
- Mute
- Printer Friendly Page
- Mark as New
- Bookmark
- Subscribe
- Mute
- Subscribe to RSS Feed
- Permalink
- Report Inappropriate Content
Dynamic label expression as column name in line chart
Hi
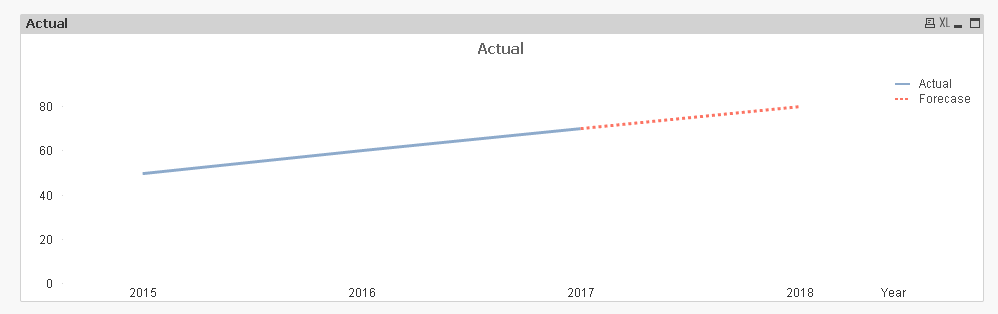
I have a line chart which is sales values from 2005 to 2025.
2005 to 2016 is actual data
2016 to 2025 is forecast data
using if(year<=2016,'<S1>','<S3>') able to differentiate actual vs Forecast,
i have one more requirement like expression label also
if(year<=2016,'Actual','forecast') whichi given in expression lable but it is not workling
Can any body do the needful for dynamic label in line chart.
Thanks
Thiru
- Mark as New
- Bookmark
- Subscribe
- Mute
- Subscribe to RSS Feed
- Permalink
- Report Inappropriate Content
Hi Thiru,
can you upload an example QVW please?
Andy
- Mark as New
- Bookmark
- Subscribe
- Mute
- Subscribe to RSS Feed
- Permalink
- Report Inappropriate Content
Is this something you are trying to do for a legend?
- Mark as New
- Bookmark
- Subscribe
- Mute
- Subscribe to RSS Feed
- Permalink
- Report Inappropriate Content
Hi Sunny,
Yes
when we keep our cursor on the chart,the label and the value will be appear right.
My case it is showing sales actual for entire line,but i want to show Actual and Forecast based on year
Thiru
- Mark as New
- Bookmark
- Subscribe
- Mute
- Subscribe to RSS Feed
- Permalink
- Report Inappropriate Content
May be using 2 expressions instead of 1?
- Mark as New
- Bookmark
- Subscribe
- Mute
- Subscribe to RSS Feed
- Permalink
- Report Inappropriate Content
Hi Sunny
Thanks,Ok.
I will use this as of now.If any solution is available please let me know
Thiru
- Mark as New
- Bookmark
- Subscribe
- Mute
- Subscribe to RSS Feed
- Permalink
- Report Inappropriate Content
As i understand, You should need to write Condition from General Tab