Unlock a world of possibilities! Login now and discover the exclusive benefits awaiting you.
- Qlik Community
- :
- All Forums
- :
- QlikView App Dev
- :
- Dynamic show of expression value for a week number...
- Subscribe to RSS Feed
- Mark Topic as New
- Mark Topic as Read
- Float this Topic for Current User
- Bookmark
- Subscribe
- Mute
- Printer Friendly Page
- Mark as New
- Bookmark
- Subscribe
- Mute
- Subscribe to RSS Feed
- Permalink
- Report Inappropriate Content
Dynamic show of expression value for a week number based on Cumulative sun and Percentage
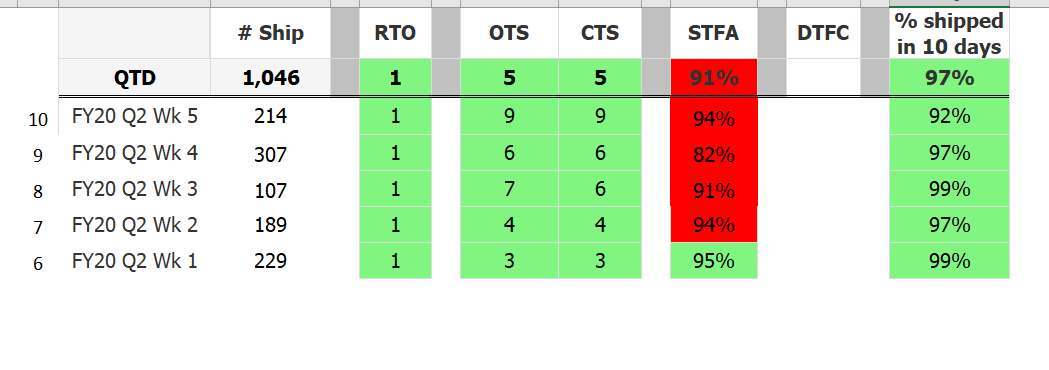
Hello Experts, Need your expertise, to guide me here. Below is the requirement , where business are used to prepare the data in excel manually, and now wants dynamically in Qlikview. Attached is the screenshot, Pivot Tables , being used by business. Highlighted in yellow are 3 different types of fields (3 fields define the number of days of an order, like time taken from Order received Dt to Shipped Dt, from Shipped Dt to Delivery Dt like that). Each Pivot shows the Cumulative sum of no of Orders with its Percentage(Cumulative total at that day/Total Orders) against no of days in row labels, for all 3 pivots. Ship week is the filter used, to select a week, and see at which particular day the 90% is achieved (highlighted in blue circle of Pivot Image) for all 3 Pivots. After this, they are manually entering details, like in Output image attached, for each week, when 90% is obtained. How can we achieve the same in Qlikview, like the Output image shown. With ShipWeek as Dimension, and all 3 fields (No of days captured against when 90% is achieved in that week). Please help me out here.
- Mark as New
- Bookmark
- Subscribe
- Mute
- Subscribe to RSS Feed
- Permalink
- Report Inappropriate Content
See duplicate post: https://community.qlik.com/t5/QlikView-Layout-Visualizations/Dynamic-show-of-expression-value-for-a-...
Regards,
Brett
I now work a compressed schedule, Tuesday, Wednesday and Thursday, so those will be the days I will reply to any follow-up posts.