Unlock a world of possibilities! Login now and discover the exclusive benefits awaiting you.
- Qlik Community
- :
- All Forums
- :
- QlikView App Dev
- :
- Re: End/Start of Period volumes
- Subscribe to RSS Feed
- Mark Topic as New
- Mark Topic as Read
- Float this Topic for Current User
- Bookmark
- Subscribe
- Mute
- Printer Friendly Page
- Mark as New
- Bookmark
- Subscribe
- Mute
- Subscribe to RSS Feed
- Permalink
- Report Inappropriate Content
End/Start of Period volumes
Hi,
I have a raw file showing policy numbers, their start dates and end dates. Someting like this:
| Policy Number | StartDate (dd/mm/yyyy) | EndDate (dd/mm/yyyy) |
| P1 | 01/01/2010 | 30/06/2010 |
| P2 | 01/01/2010 | 31/12/2010 |
| P3 | 01/01/2010 | 31/12/2010 |
| P4 | 01/02/2010 | 31/12/2010 |
| P5 | 01/06/2010 | 30/06/2010 |
| P6 | 01/06/2010 | 30/06/2010 |
| P7 | 01/06/2010 | 31/07/2010 |
| P8 | 01/06/2010 | 31/12/2010 |
| P9 | 01/06/2010 | 31/12/2010 |
| P10 | 01/06/2010 | 31/12/2010 |
What i want to get is a table that will calculate the volumes of in-force policies at month start for the 12 months of 2010. Something like this:
| Month | Jan-10 | Feb-10 | Mar-10 | Apr-10 | May-10 | Jun-10 | Jul-10 | Aug-10 | Sep-10 | Oct-10 | Nov-10 | Dec-10 |
| In-Force policies | 3 | 4 | 4 | 4 | 4 | 10 | 7 | 7 | 7 | 7 | 7 | 7 |
How to script this - any suggestions are most welcome?
I only managed to get this view but i find it hard to present it the way shown above:
| Month | Started | Ended |
| Jan 2010 | 3 | 0 |
| Feb 2010 | 1 | 0 |
| Jun 2010 | 6 | 3 |
| Jul 2010 | 0 | 1 |
| Dec 2010 | 0 | 6 |
Best Regards & Thanks,
Artur
- « Previous Replies
-
- 1
- 2
- Next Replies »
Accepted Solutions
- Mark as New
- Bookmark
- Subscribe
- Mute
- Subscribe to RSS Feed
- Permalink
- Report Inappropriate Content
So if you use interval match in the load script, you can create a Date field to use as part of your dimension:
SET ThousandSep=',';
SET DecimalSep='.';
SET MoneyThousandSep=',';
SET MoneyDecimalSep='.';
SET MoneyFormat='$#,##0.00;($#,##0.00)';
SET TimeFormat='h:mm:ss TT';
SET DateFormat='DD/MM/YYYY';
SET TimestampFormat='DD/MM/YYYY h:mm:ss[.fff] TT';
SET MonthNames='Jan;Feb;Mar;Apr;May;Jun;Jul;Aug;Sep;Oct;Nov;Dec';
SET DayNames='Mon;Tue;Wed;Thu;Fri;Sat;Sun';
Data:
LOAD * INLINE [
Policy Number, StartDate (dd/mm/yyyy), EndDate (dd/mm/yyyy)
P1, 01/01/2010, 30/06/2010
P2, 01/01/2010, 31/12/2010
P3, 01/01/2010, 31/12/2010
P4, 01/02/2010, 31/12/2010
P5, 01/06/2010, 30/06/2010
P6, 01/06/2010, 30/06/2010
P7, 01/06/2010, 31/07/2010
P8, 01/06/2010, 31/12/2010
P9, 01/06/2010, 31/12/2010
P10, 01/06/2010, 31/12/2010
];
MinAndMax:
LOAD min([StartDate (dd/mm/yyyy)]) as MinDate,
max([EndDate (dd/mm/yyyy)]) as MaxDate
RESIDENT Data;
let MinDate = num(PEEK('MinDate',0,'MinAndMax'));
let MaxDate = num(PEEK('MaxDate',0,'MinAndMax'));
DROP TABLE MinAndMax;
Calendar:
Load Date($(MinDate)-1+iterno()) as Date, Date(monthstart($(MinDate)-1+iterno()),'MMM YYYY') as Month autogenerate 1 While iterno() <= $(MaxDate)+1 - $(MinDate) ;
let MinDate = null();
let MaxDate = null();
IntervalMatch(Date)
LOAD [StartDate (dd/mm/yyyy)], [EndDate (dd/mm/yyyy)] RESIDENT Data;
Then you can create a pivot table where
Dimension: Month
Expression: count(distinct [Policy Number])
And then pivot the dimension so it goes across the top as columns.
Example file is also attached.
- Mark as New
- Bookmark
- Subscribe
- Mute
- Subscribe to RSS Feed
- Permalink
- Report Inappropriate Content
Hey Artur,
Is it possible to attach a sample file.
How do you determine which is a In force policy and how do you calculate the months(based on what field/logic)
Thanks
AJ
- Mark as New
- Bookmark
- Subscribe
- Mute
- Subscribe to RSS Feed
- Permalink
- Report Inappropriate Content
So if you use interval match in the load script, you can create a Date field to use as part of your dimension:
SET ThousandSep=',';
SET DecimalSep='.';
SET MoneyThousandSep=',';
SET MoneyDecimalSep='.';
SET MoneyFormat='$#,##0.00;($#,##0.00)';
SET TimeFormat='h:mm:ss TT';
SET DateFormat='DD/MM/YYYY';
SET TimestampFormat='DD/MM/YYYY h:mm:ss[.fff] TT';
SET MonthNames='Jan;Feb;Mar;Apr;May;Jun;Jul;Aug;Sep;Oct;Nov;Dec';
SET DayNames='Mon;Tue;Wed;Thu;Fri;Sat;Sun';
Data:
LOAD * INLINE [
Policy Number, StartDate (dd/mm/yyyy), EndDate (dd/mm/yyyy)
P1, 01/01/2010, 30/06/2010
P2, 01/01/2010, 31/12/2010
P3, 01/01/2010, 31/12/2010
P4, 01/02/2010, 31/12/2010
P5, 01/06/2010, 30/06/2010
P6, 01/06/2010, 30/06/2010
P7, 01/06/2010, 31/07/2010
P8, 01/06/2010, 31/12/2010
P9, 01/06/2010, 31/12/2010
P10, 01/06/2010, 31/12/2010
];
MinAndMax:
LOAD min([StartDate (dd/mm/yyyy)]) as MinDate,
max([EndDate (dd/mm/yyyy)]) as MaxDate
RESIDENT Data;
let MinDate = num(PEEK('MinDate',0,'MinAndMax'));
let MaxDate = num(PEEK('MaxDate',0,'MinAndMax'));
DROP TABLE MinAndMax;
Calendar:
Load Date($(MinDate)-1+iterno()) as Date, Date(monthstart($(MinDate)-1+iterno()),'MMM YYYY') as Month autogenerate 1 While iterno() <= $(MaxDate)+1 - $(MinDate) ;
let MinDate = null();
let MaxDate = null();
IntervalMatch(Date)
LOAD [StartDate (dd/mm/yyyy)], [EndDate (dd/mm/yyyy)] RESIDENT Data;
Then you can create a pivot table where
Dimension: Month
Expression: count(distinct [Policy Number])
And then pivot the dimension so it goes across the top as columns.
Example file is also attached.
- Mark as New
- Bookmark
- Subscribe
- Mute
- Subscribe to RSS Feed
- Permalink
- Report Inappropriate Content
Hi Nicole,
Many thanks for your help - this works perfectly for me now.
Best Regards,
Artur
- Mark as New
- Bookmark
- Subscribe
- Mute
- Subscribe to RSS Feed
- Permalink
- Report Inappropriate Content
Please mark correct and helpful answers so that others can find solutions to their problems too 
- Mark as New
- Bookmark
- Subscribe
- Mute
- Subscribe to RSS Feed
- Permalink
- Report Inappropriate Content
Hi Nicole, thanks for your help so far!
in my example i also want to report on New policies and expired/cancelled policied (by End date). What's happening after introducing IntevalMatch is that the synthetic key is causing loops in the data model and the calculation is wrong (my script is probably too basic hence the loop).
My workaround was to stop using Intervalmatch and calculate monthly values of New Policies and Expired/Cancelled Policies. Then in the pivot table i used Above() function to calculate accumulated values of New Policies and Expired/Cancelled Policies. My In-Force volumes is just a simple equasion: New Policies - Expired/Cancelled Policies. The pivot consists of the following :
Dimensions:
CalendatMonthAndYear
Expressions:
Started - =count({<DateType={'Start'}>} distinct Policy)
Expired/Cancelled =count({<DateType={'End'}>} Policy)
Live =rangesum(Above(Live),Started)
Dropped =rangesum(Above(Dropped),[Expired/Cancelled])
InForce =Live-Dropped
(the full code is in the attached app, please)
But this solution has some disadvantages: pivoting needs to be switched off as when you change the layout of the table the results go wrong, there are 2 extra columns that i need to hide, In-Force policies volumes are calculated at month end whereas IntervalMatch was giving month-start volumes.
Would you have any clues on how to override the loop and the synthetic key in the data model with IntervalMatch?
I have attached 2 versions of my app:
1. InForcePoliciesByMonth - IntervalMatch causes loops.qvw
2. InForcePoliciesByMonth - IntervalMatch replaced by Above.qvw
rgds,
Artur
- Mark as New
- Bookmark
- Subscribe
- Mute
- Subscribe to RSS Feed
- Permalink
- Report Inappropriate Content
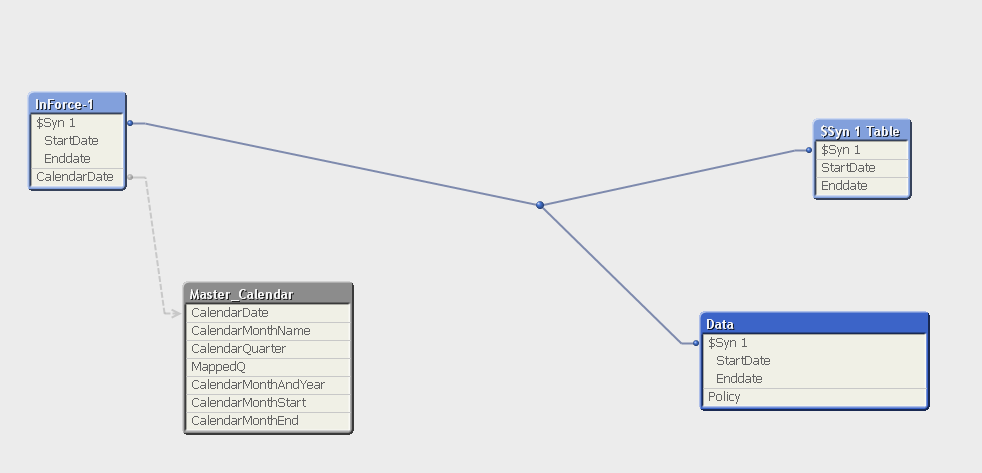
I'm not sure why you have the PoliciesFinal table. It shouldn't be needed as the data is already in the Data and Master_Calendar tables...
For the interval match table, interval match on CalendarDate instead of on CalendarMonthAndYear.
Then your data structure should look something like this (the link between InForce and Master_Calendar should not be a dotted line any longer once you get rid of the loop by doing what I mentioned above):
- Mark as New
- Bookmark
- Subscribe
- Mute
- Subscribe to RSS Feed
- Permalink
- Report Inappropriate Content
Hello Ajay,
i have attached one, please.
rgds
Artur
- Mark as New
- Bookmark
- Subscribe
- Mute
- Subscribe to RSS Feed
- Permalink
- Report Inappropriate Content
Nicole, many thanks again.
without the PoliciesFinal table I do not know how to calculate volumes of New Policies (based on Start date) and Expired/Cancelled Policies (Based on EndDate) in the same pivot that shows the In-Force ones. I need to get something like this:
| Month | New Policies | Expired Policies | In-Force Policies at month start |
|---|---|---|---|
| Jan 2010 | 3 | 0 | 3 |
| Feb 2010 | 1 | 0 | 4 |
| Mar 2010 | 0 | 0 | 4 |
| Jun 2010 | 6 | 3 | 10 |
rgds,
Artur
- Mark as New
- Bookmark
- Subscribe
- Mute
- Subscribe to RSS Feed
- Permalink
- Report Inappropriate Content
Can you post the file with that fix? I can help you get that table then.
- « Previous Replies
-
- 1
- 2
- Next Replies »