Unlock a world of possibilities! Login now and discover the exclusive benefits awaiting you.
- Qlik Community
- :
- All Forums
- :
- QlikView App Dev
- :
- Error in expression... still works, kind of
- Subscribe to RSS Feed
- Mark Topic as New
- Mark Topic as Read
- Float this Topic for Current User
- Bookmark
- Subscribe
- Mute
- Printer Friendly Page
- Mark as New
- Bookmark
- Subscribe
- Mute
- Subscribe to RSS Feed
- Permalink
- Report Inappropriate Content
Error in expression... still works, kind of
Expression:
min(sum({$<[Year],[Month]>} MembershipFlag))
It works, but if I try to add anything to it it doesn't (example: min(sum({$<[Year],[Month]>} MembershipFlag)) *.9)
Can someone help me fix this? I'm using this expression as an axis static minimum, maybe that has something to do with it.
Thanks,
Joe
Accepted Solutions
- Mark as New
- Bookmark
- Subscribe
- Mute
- Subscribe to RSS Feed
- Permalink
- Report Inappropriate Content
Hi Joe,
as Marcus said, you'll need to aggregate your sum across those dimensions to then get the min, so
min(aggr(sum(MembershipFlag2), Year,Month,Association))
should do the trick
I've removed the set analysis on year and month, as from your picture it shows your expression is just the sum as is.
If you kept it in, you would potentially get a min value from say 2010 (as it would look and pick the min across all years) even when selecting just 2012-2014 in the chart, which i'm thinking you might not want
hope that helps
Joe
- Mark as New
- Bookmark
- Subscribe
- Mute
- Subscribe to RSS Feed
- Permalink
- Report Inappropriate Content
It's the nested aggregation without a total or an aggr, try:
min(aggr(sum({$<[Year],[Month]>} MembershipFlag), YOURDIMENSIONS))
- Marcus
- Mark as New
- Bookmark
- Subscribe
- Mute
- Subscribe to RSS Feed
- Permalink
- Report Inappropriate Content
Hi Joe,
you are trying to nest aggregations there without anything to group by, so you will have problems yes. What are you trying to achieve?
Is there a dimension you are using in your chart and you are wanting the minimum count of membership flags by dimension?
Joe
- Mark as New
- Bookmark
- Subscribe
- Mute
- Subscribe to RSS Feed
- Permalink
- Report Inappropriate Content
The sum of membershipFlags is my dimension. This is a static min calculation.
- Mark as New
- Bookmark
- Subscribe
- Mute
- Subscribe to RSS Feed
- Permalink
- Report Inappropriate Content
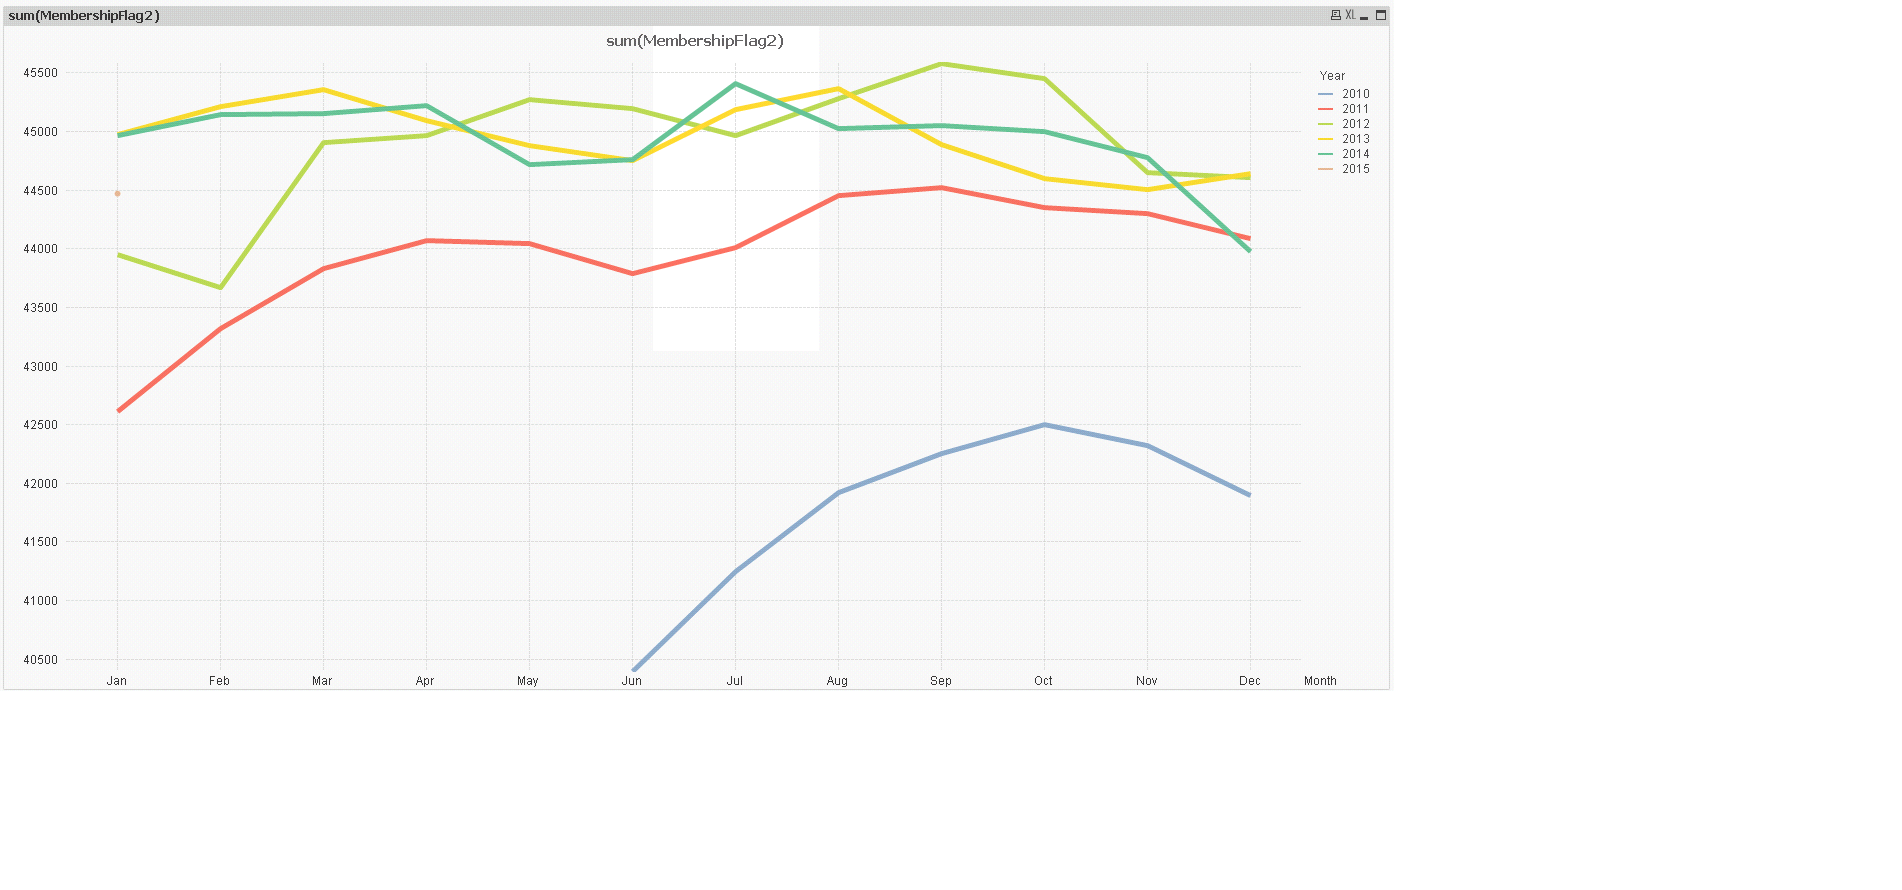
Basically take the lowest sum of membership flags based on year, month and association. Remember that chart from yesterday? Same one:

- Mark as New
- Bookmark
- Subscribe
- Mute
- Subscribe to RSS Feed
- Permalink
- Report Inappropriate Content
Hi Joe,
as Marcus said, you'll need to aggregate your sum across those dimensions to then get the min, so
min(aggr(sum(MembershipFlag2), Year,Month,Association))
should do the trick
I've removed the set analysis on year and month, as from your picture it shows your expression is just the sum as is.
If you kept it in, you would potentially get a min value from say 2010 (as it would look and pick the min across all years) even when selecting just 2012-2014 in the chart, which i'm thinking you might not want
hope that helps
Joe
- Mark as New
- Bookmark
- Subscribe
- Mute
- Subscribe to RSS Feed
- Permalink
- Report Inappropriate Content
You're the man, Joe Simmons. Thanks again!
Joe
- Mark as New
- Bookmark
- Subscribe
- Mute
- Subscribe to RSS Feed
- Permalink
- Report Inappropriate Content
no problem , glad to help
Joe
- Mark as New
- Bookmark
- Subscribe
- Mute
- Subscribe to RSS Feed
- Permalink
- Report Inappropriate Content
Ok, I had some other things to take care of but I'm back at this again. I finally got around to plugging in what you put and it didn't give me the desired result.

This is with the previous min axis equation of: min(sum(MembershipFlag2))). Though it gives me an error this is very close to what I want, I simply want a little more room on the top and the bottom and when I add or subtract 1000 to this equation nothing happens.
When I do the aggregate sum you suggested I get the same thing (as the graph above). I tried min(aggr(sum(MembershipFlag2), Association, Year, Month)) - 1000 and it still doesn't move it down 1000, I also tried to multiply it by .9 and such and it still doesn't move the graph down. Any suggestions?