Unlock a world of possibilities! Login now and discover the exclusive benefits awaiting you.
- Qlik Community
- :
- All Forums
- :
- QlikView App Dev
- :
- Error sum value bar chart
- Subscribe to RSS Feed
- Mark Topic as New
- Mark Topic as Read
- Float this Topic for Current User
- Bookmark
- Subscribe
- Mute
- Printer Friendly Page
- Mark as New
- Bookmark
- Subscribe
- Mute
- Subscribe to RSS Feed
- Permalink
- Report Inappropriate Content
Error sum value bar chart
Hello,
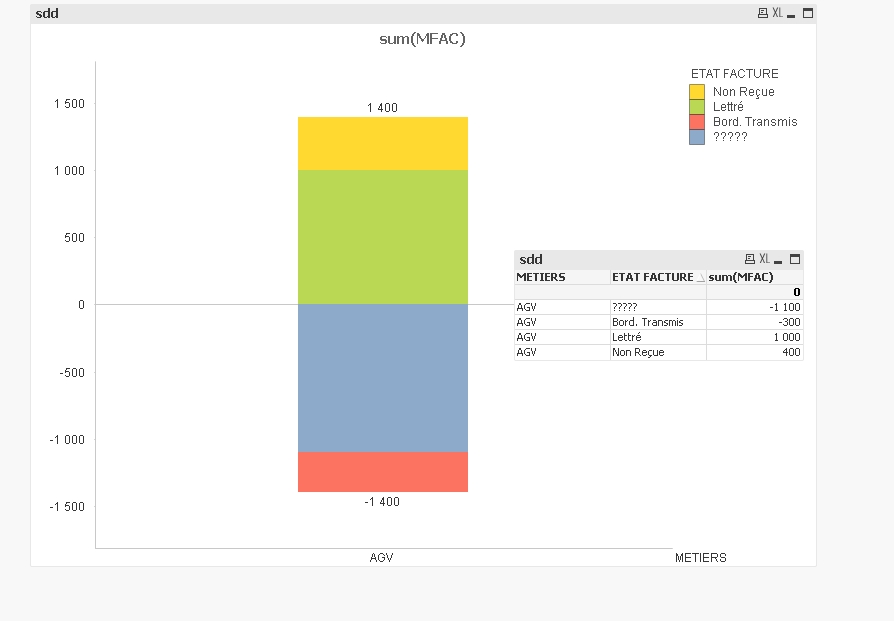
I have a bar chart with an expession sum(MFAC) who give the total but this total is false.
If I change bar chart to straight table with same expression an same dimenssion, the total is correct.

Someone have an idea why in bar chart the total is different from straignt table? It seem that the negative value (- 366 600) is not calculate is bar chart.
- Mark as New
- Bookmark
- Subscribe
- Mute
- Subscribe to RSS Feed
- Permalink
- Report Inappropriate Content
Can you please load your sample file?
- Mark as New
- Bookmark
- Subscribe
- Mute
- Subscribe to RSS Feed
- Permalink
- Report Inappropriate Content
if your axes start at 0 and up, maybe it is not calculated...
- Mark as New
- Bookmark
- Subscribe
- Mute
- Subscribe to RSS Feed
- Permalink
- Report Inappropriate Content
Hello,
Find attached a sample, if I use a csubtype grouped, I see all values, negative too, but when I use the subtype grouped only the positve value are available, no negative value.
I need to have a bar chart grouped with total = posite value - negative value.
- Mark as New
- Bookmark
- Subscribe
- Mute
- Subscribe to RSS Feed
- Permalink
- Report Inappropriate Content
Please check enclosed file.
The negative value is indeed coming but due to the big difference between negative and positive value, it's not clearly visible.
I have remove the stacked option and you can see the value is coming.
Hope this help
- Mark as New
- Bookmark
- Subscribe
- Mute
- Subscribe to RSS Feed
- Permalink
- Report Inappropriate Content
Thank you Manish,
The problem is the total of expression when the chart is stacked is false.
The total is 675 747 684 when is stacked or it's must be 675 381 084 (-366 600 + 672 742 164 + 3 005 520 = 675 381 084) why?
- Mark as New
- Bookmark
- Subscribe
- Mute
- Subscribe to RSS Feed
- Permalink
- Report Inappropriate Content
This is a two dimension and one expression chart.
How can you expect a total as the one which you have mentioned above.
There are two ways to get the desired total in Bar Chart
1) Remove the 2nd expression ETAT FACTURE and you can now see that your chart is showing the total you want..
2) Go to Expression tab and untick Values on Data Point for the SUM(MFAC) expression.
Now Add one more Expression SUM(Total MFAC) and Untick Bar and Tick Values on DataPoint...
Hope this will help you.
- Mark as New
- Bookmark
- Subscribe
- Mute
- Subscribe to RSS Feed
- Permalink
- Report Inappropriate Content
IMHO the total is correct
or would you prefer 0 as total?
