Unlock a world of possibilities! Login now and discover the exclusive benefits awaiting you.
- Qlik Community
- :
- All Forums
- :
- QlikView App Dev
- :
- Excel SUMIFS function equivalent in Qlikview Expre...
- Subscribe to RSS Feed
- Mark Topic as New
- Mark Topic as Read
- Float this Topic for Current User
- Bookmark
- Subscribe
- Mute
- Printer Friendly Page
- Mark as New
- Bookmark
- Subscribe
- Mute
- Subscribe to RSS Feed
- Permalink
- Report Inappropriate Content
Excel SUMIFS function equivalent in Qlikview Expression
Hi All,
I need one help to get a logic of Excel SUMIFS function in Qlikview Expression.
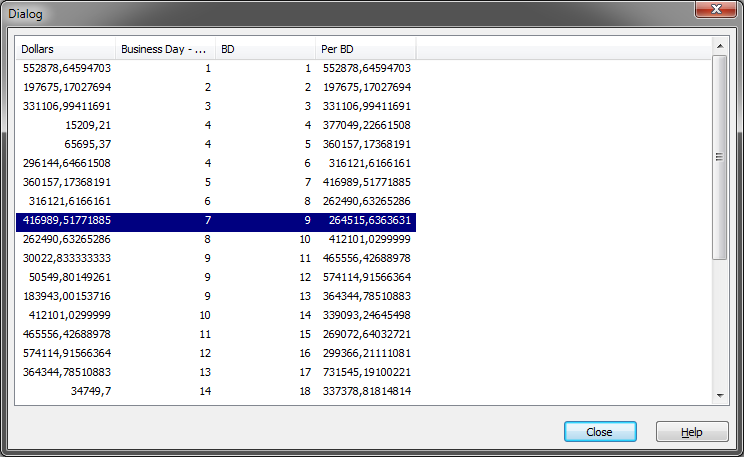
Here in attached excel, wherever BD column value is present in [Business Day - Roll to Monday] column, corresponding Dollars column values will be sum-up and comes under [Per BD] column and [Per BD] column should be a calculated Qlikview Expression.
I have tried using below expression-
=If(BD=Aggr(NODISTINCT [Business Day - Roll to Monday],[Business Day - Roll to Monday]),Sum(total <[Business Day - Roll to Monday]> Dollars),0)
but not getting all data in [Per BD] column.
Can someone help me to find the correct logic.
Accepted Solutions
- Mark as New
- Bookmark
- Subscribe
- Mute
- Subscribe to RSS Feed
- Permalink
- Report Inappropriate Content
May be this
=SubField(Concat(TOTAL Aggr(Sum(Dollars), [Business Day - Roll to Monday]), '|', [Business Day - Roll to Monday]), '|', BD)
- Mark as New
- Bookmark
- Subscribe
- Mute
- Subscribe to RSS Feed
- Permalink
- Report Inappropriate Content
What is the dimension of this chart where you are trying to show this?
- Mark as New
- Bookmark
- Subscribe
- Mute
- Subscribe to RSS Feed
- Permalink
- Report Inappropriate Content
Hi,
in Script:
Mapping TMP: LOAD [Business Day - Roll to Monday],SUM(Dollars) AS Dollars
FROM [..\..\Documents\Downloads\Sample IFS function.xlsx] (ooxml, embedded labels, table is data)
Group BY [Business Day - Roll to Monday]
;
LOAD *, ApplyMap('TMP',BD,'0') AS [Per BD];
LOAD Dollars,
[Business Day - Roll to Monday],
BD
FROM
[..\..\Documents\Downloads\Sample IFS function.xlsx] (ooxml, embedded labels, table is data);

- Mark as New
- Bookmark
- Subscribe
- Mute
- Subscribe to RSS Feed
- Permalink
- Report Inappropriate Content
May be this
=SubField(Concat(TOTAL Aggr(Sum(Dollars), [Business Day - Roll to Monday]), '|', [Business Day - Roll to Monday]), '|', BD)
- Mark as New
- Bookmark
- Subscribe
- Mute
- Subscribe to RSS Feed
- Permalink
- Report Inappropriate Content
Thanks Fer for the help but I am looking for a Qlikview Expression instead of writing it in script.
- Mark as New
- Bookmark
- Subscribe
- Mute
- Subscribe to RSS Feed
- Permalink
- Report Inappropriate Content
Genius ![]()
- Mark as New
- Bookmark
- Subscribe
- Mute
- Subscribe to RSS Feed
- Permalink
- Report Inappropriate Content
Hey Sunny,
Thanks for the quick help. This logic is working perfectly for my requirement.
You made my day!!
Thanks a lot Brother... ![]()
![]()
- Mark as New
- Bookmark
- Subscribe
- Mute
- Subscribe to RSS Feed
- Permalink
- Report Inappropriate Content
No problem at all ![]()
Please close the thread by marking correct and helpful responses.
Best,
Sunny
- Mark as New
- Bookmark
- Subscribe
- Mute
- Subscribe to RSS Feed
- Permalink
- Report Inappropriate Content
Hahahaha which you just did ![]()