Unlock a world of possibilities! Login now and discover the exclusive benefits awaiting you.
- Qlik Community
- :
- All Forums
- :
- QlikView App Dev
- :
- Re: Expression for showing percentage in bar chart
- Subscribe to RSS Feed
- Mark Topic as New
- Mark Topic as Read
- Float this Topic for Current User
- Bookmark
- Subscribe
- Mute
- Printer Friendly Page
- Mark as New
- Bookmark
- Subscribe
- Mute
- Subscribe to RSS Feed
- Permalink
- Report Inappropriate Content
Expression for showing percentage in bar chart
Friends,
I have two bar charts as in the screenshot below,
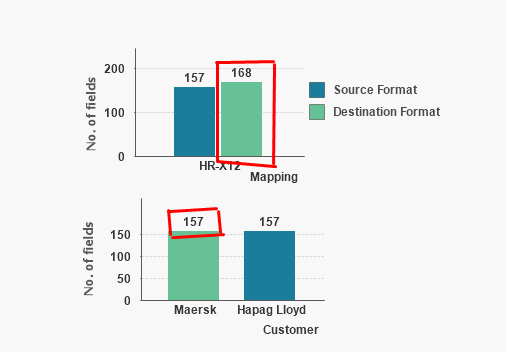
I need to compare that count (157) in the second bar chart with the count (168) in the first bar chart and to show it as a percentage value. Please help me for expression to achieve this friends.
- Mark as New
- Bookmark
- Subscribe
- Mute
- Subscribe to RSS Feed
- Permalink
- Report Inappropriate Content
What is the dimension and expression you used in 1st Bar?
What is the dimension and expression you used in 2nd Bar?
Can you provide some more information? may be sample data or sample app !
- Mark as New
- Bookmark
- Subscribe
- Mute
- Subscribe to RSS Feed
- Permalink
- Report Inappropriate Content
I've used Mapping as dimension in the first bar chart and customer as dimension in the second bar chart... also attached sample data.
- Mark as New
- Bookmark
- Subscribe
- Mute
- Subscribe to RSS Feed
- Permalink
- Report Inappropriate Content
Where is the measure here?
- Mark as New
- Bookmark
- Subscribe
- Mute
- Subscribe to RSS Feed
- Permalink
- Report Inappropriate Content
I have field names as measure in these charts and I'm using those fields in another excel sheet. Do you want me to share that sheet too?
- Mark as New
- Bookmark
- Subscribe
- Mute
- Subscribe to RSS Feed
- Permalink
- Report Inappropriate Content
How can anyone give you expression without knowing what you are using as field names?
What are your expressions?
Try to provide as much as possible information at first go while raising questions..
QlikCommunity Tip: How to get answers to your post?
Preparing examples for Upload - Reduction and Data Scrambling
- Mark as New
- Bookmark
- Subscribe
- Mute
- Subscribe to RSS Feed
- Permalink
- Report Inappropriate Content
Ok Manish, I have shared the data with all the fields count. Plz check with it.
- Mark as New
- Bookmark
- Subscribe
- Mute
- Subscribe to RSS Feed
- Permalink
- Report Inappropriate Content
And do you want me to guess about 157 and 168?