Unlock a world of possibilities! Login now and discover the exclusive benefits awaiting you.
- Qlik Community
- :
- All Forums
- :
- QlikView App Dev
- :
- Re: Expression results different in Straight and B...
- Subscribe to RSS Feed
- Mark Topic as New
- Mark Topic as Read
- Float this Topic for Current User
- Bookmark
- Subscribe
- Mute
- Printer Friendly Page
- Mark as New
- Bookmark
- Subscribe
- Mute
- Subscribe to RSS Feed
- Permalink
- Report Inappropriate Content
Expression results different in Straight and Bar chart
Hi Folks,
I'm using below expression in a straight table :
=if(Match(Name,'E'),NetWorkDays(min({$<Name=>}Date),max(Date))*8 ,NetWorkDays(min({<Name=>}Date),max({<Name=>}Date))*8)
Which is giving me desired output.
But when I'm using the same expression in bar chart results are different. For example :
When I'm selecting below Name ="A" , the correct number is 168 , but Bar chart is showing me 48

and same for E straight table showing me 48 , but bar 8.

Please suggest why , attached is sample data.
Note : For only Name ="E" Date is database is 9/8//2017 , so just for this calculation =NetWorkDays(min(Date),max(Date))*8) should run until 8th of Sep and for rest Names it should consider all Dates except weekends , doesn't matter if corresponding Date value available in DB and that's why I have created Master Calendar.
Regards,
Amit
- Tags:
- qlikview_scripting
- « Previous Replies
- Next Replies »
Accepted Solutions
- Mark as New
- Bookmark
- Subscribe
- Mute
- Subscribe to RSS Feed
- Permalink
- Report Inappropriate Content
So, based on variable, I am creating a EndDate for the employee which have ended employment....
Script
LET vMinDate = num(makedate('2017'));
LET vMaxDate = num(today());
Datefield:
LOAD
$(vMinDate) + IterNo() -1 as Datefield
AUTOGENERATE (1)
WHILE $(vMinDate) + IterNo() -1 <= $(vMaxDate);
Calendar:
LOAD
Date(Datefield,'M/D/YYYY') as %Date,
date(Datefield) as Date,
year(Datefield) as Year,
month(Datefield) as Month,
day(Datefield) as Day,
week(Datefield) as Week,
weekday(Datefield) as Weekday
RESIDENT Datefield;
Table:
LOAD *,
If(SubStringCount('$(vEndedEmployee)', Name), 1, 0) as EndedFlag;
LOAD * INLINE [
Name, %Date, Sheets
A, 9/1/2017, 3
A, 9/2/2017, 1
A, 9/3/2017, 1
A, 9/4/2017, 1
A, 9/5/2017, 1
A, 9/6/2017, 1
A, 9/7/2017, 1
A, 9/8/2017, 1
B, 9/1/2017, 2
B, 9/4/2017, 3
B, 9/6/2017, 6
B, 9/8/2017, 3
B, 9/11/2017, 7
B, 9/13/2017, 5
B, 9/18/2017, 1
B, 9/19/2017, 11
B, 9/20/2017, 8
B, 9/21/2017, 3
B, 9/25/2017, 2
B, 9/26/2017, 5
B, 9/27/2017, 3
B, 9/28/2017, 8
B, 9/30/2017, 2
C, 9/1/2017, 2
C, 9/4/2017, 5
C, 9/5/2017, 2
C, 9/6/2017, 3
C, 9/7/2017, 3
C, 9/8/2017, 1
C, 9/11/2017, 1
C, 9/12/2017, 4
C, 9/14/2017, 2
C, 9/18/2017, 5
C, 9/19/2017, 2
C, 9/20/2017, 7
C, 9/21/2017, 2
C, 9/25/2017, 2
C, 9/26/2017, 7
C, 9/27/2017, 5
C, 9/28/2017, 2
D, 9/12/2017, 1
D, 9/13/2017, 1
D, 9/19/2017, 2
D, 9/20/2017, 1
D, 9/26/2017, 1
D, 9/27/2017, 23
D, 9/28/2017, 1
E, 9/8/2017, 50
E, 6/1/2017, 1
E, 6/1/2017, 2
E, 6/5/2017, 1
E, 6/6/2017, 1
E, 6/6/2017, 4
E, 6/7/2017, 1
E, 6/8/2017, 1
E, 6/9/2017, 1
E, 6/13/2017, 1
E, 6/13/2017, 4
E, 6/14/2017, 1
E, 6/15/2017, 1
E, 6/16/2017, 1
E, 6/19/2017, 1
E, 6/20/2017, 3
E, 6/22/2017, 1
E, 6/22/2017, 2
E, 6/23/2017, 1
E, 6/27/2017, 3
E, 6/28/2017, 1
E, 6/29/2017, 1
A, 6/1/2017, 3
A, 6/2/2017, 2
A, 6/5/2017, 1
A, 6/6/2017, 1
A, 6/7/2017, 1
A, 6/8/2017, 1
A, 6/8/2017, 5
A, 6/12/2017, 1
A, 6/12/2017, 2
A, 6/13/2017, 1
A, 6/15/2017, 1
A, 6/16/2017, 1
A, 6/20/2017, 1
A, 6/20/2017, 2
A, 6/21/2017, 2
A, 6/22/2017, 2
A, 6/27/2017, 4
A, 6/27/2017, 5
A, 6/29/2017, 1
];
Left Join (Table)
LOAD Name,
Max(%Date) as EndDate
Resident Table
Where EndedFlag = 1
Group By Name;
Expression
NetWorkDays(Min(TOTAL {<Name=>}Date), RangeMin(Max(TOTAL {<Name=>}Date), Max({<Name=>}EndDate)))*8
- Mark as New
- Bookmark
- Subscribe
- Mute
- Subscribe to RSS Feed
- Permalink
- Report Inappropriate Content
In general it should show 8 hours a day except weekends , doesn't matter if last day (Entry) against Sheets is 9/8/2017 , it should calculate 8*per day till month end i.e. 9/29/2017

And for only Name =E , it should calculate perday*8 till 9/8/2017 (The last Date entered against "Sheets") as it was last day for E in firm.

Regards,
AS
- Mark as New
- Bookmark
- Subscribe
- Mute
- Subscribe to RSS Feed
- Permalink
- Report Inappropriate Content
tresesco Any suggestion.
Regards,AS
- Mark as New
- Bookmark
- Subscribe
- Mute
- Subscribe to RSS Feed
- Permalink
- Report Inappropriate Content
Do you need this?
=if(Match(Only({$<Name=>}Name),'E'),NetWorkDays(min(TOTAL {$<Name=>}Date),max(TOTAL Date))*8 ,NetWorkDays(min(TOTAL {<Name=>}Date),max(TOTAL {<Name=>}Date))*8)
- Mark as New
- Bookmark
- Subscribe
- Mute
- Subscribe to RSS Feed
- Permalink
- Report Inappropriate Content
Hi Sunny,
Sorry not like this.
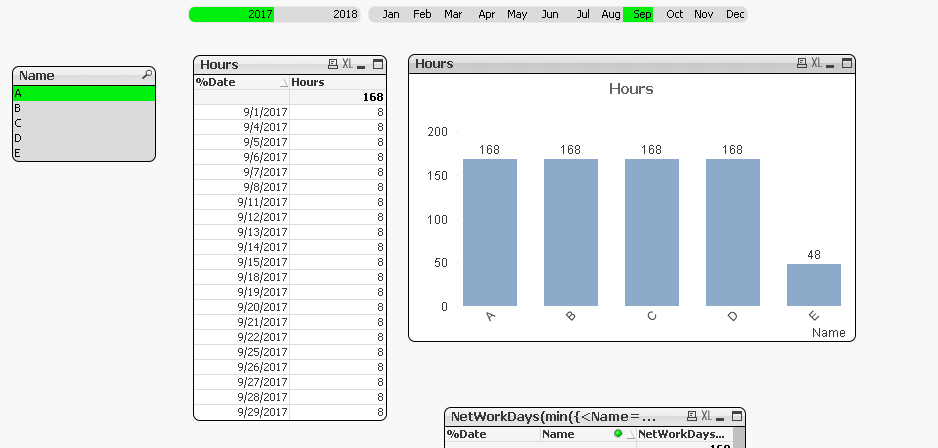
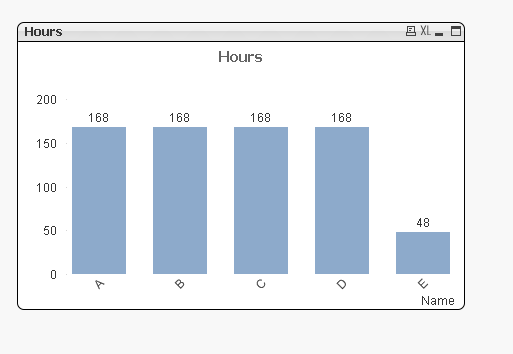
When we select A from list box it should show only one bar for A=168 , same for B=168,C=168, D=168 and for E=48
Output when only year=2017 , Month= Sep is selected should be look like this:
Thanks,
AS
- Mark as New
- Bookmark
- Subscribe
- Mute
- Subscribe to RSS Feed
- Permalink
- Report Inappropriate Content
Try this
=if(Match(Name,'E'),NetWorkDays(Min(TOTAL {$<Name=>}Date), Max({<Name = {'E'}>}TOTAL Date))*8 ,NetWorkDays(min(TOTAL {<Name=>}Date),max(TOTAL {<Name=>}Date))*8)
- Mark as New
- Bookmark
- Subscribe
- Mute
- Subscribe to RSS Feed
- Permalink
- Report Inappropriate Content
Thanks Sunny!
Regards,
AS
- Mark as New
- Bookmark
- Subscribe
- Mute
- Subscribe to RSS Feed
- Permalink
- Report Inappropriate Content
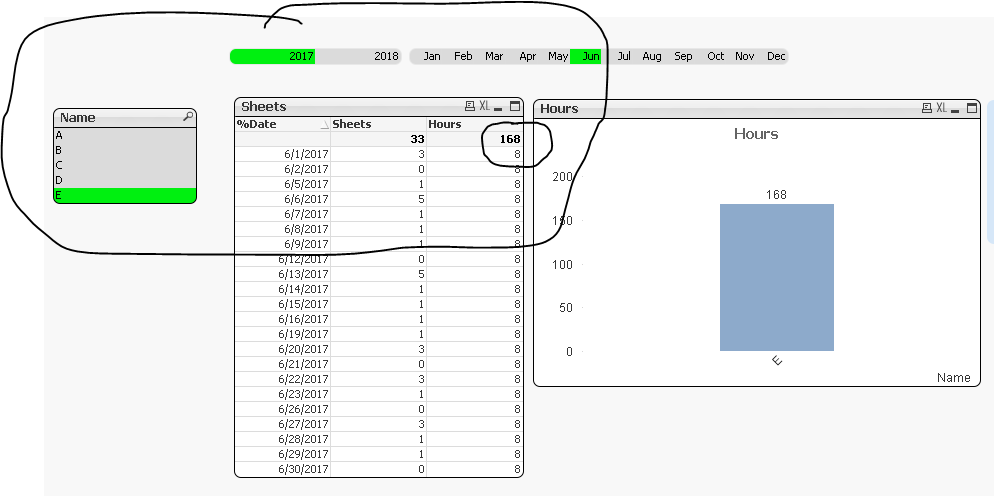
Hi Sunny,
Sorry , still some issue. Please see results for June E is showing 168 , but it should be same as A=176

Except Sep month , Value of E should be always equal to A,B ,C and D.
PFA!
Regards,
AS
- Mark as New
- Bookmark
- Subscribe
- Mute
- Subscribe to RSS Feed
- Permalink
- Report Inappropriate Content
Why is that so? I thought you wanted this to the chart... when I select E, 2017, and June... I see 168... why would the chart not show 168 in the bar chart?
I think till now we were only looking at the numbers you wanted, may be it would be better if you can explain your requirement because I am not sure what logic you are using to get to the numbers you have been asking for.
- Mark as New
- Bookmark
- Subscribe
- Mute
- Subscribe to RSS Feed
- Permalink
- Report Inappropriate Content
Hi Sunny,
I believe best is to tell you what is requirement.
Let me try to explain - We are have Name (Employees) as A,B,C,D and E in database (Excel) where they are entering number of documents on some particular Date in a Month.
Data Sample:
| Name | Date | Sheets |
| A | 9/1/2017 | 3 |
| A | 9/2/2017 | 1 |
| A | 9/3/2017 | 1 |
| A | 9/4/2017 | 1 |
| A | 9/5/2017 | 1 |
| A | 9/6/2017 | 1 |
| A | 9/7/2017 | 1 |
| A | 9/8/2017 | 1 |
| B | 9/1/2017 | 2 |
| B | 9/4/2017 | 3 |
| B | 9/6/2017 | 6 |
| B | 9/8/2017 | 3 |
| B | 9/11/2017 | 7 |
| B | 9/13/2017 | 5 |
| B | 9/18/2017 | 1 |
| B | 9/19/2017 | 11 |
| B | 9/20/2017 | 8 |
| B | 9/21/2017 | 3 |
| B | 9/25/2017 | 2 |
| B | 9/26/2017 | 5 |
| B | 9/27/2017 | 3 |
| B | 9/28/2017 | 8 |
| B | 9/30/2017 | 2 |
| C | 9/1/2017 | 2 |
| C | 9/4/2017 | 5 |
| C | 9/5/2017 | 2 |
| C | 9/6/2017 | 3 |
| C | 9/7/2017 | 3 |
| C | 9/8/2017 | 1 |
| C | 9/11/2017 | 1 |
| C | 9/12/2017 | 4 |
| C | 9/14/2017 | 2 |
| C | 9/18/2017 | 5 |
| C | 9/19/2017 | 2 |
| C | 9/20/2017 | 7 |
| C | 9/21/2017 | 2 |
| C | 9/25/2017 | 2 |
| C | 9/26/2017 | 7 |
| C | 9/27/2017 | 5 |
| C | 9/28/2017 | 2 |
| D | 9/12/2017 | 1 |
| D | 9/13/2017 | 1 |
| D | 9/19/2017 | 2 |
| D | 9/20/2017 | 1 |
| D | 9/26/2017 | 1 |
| D | 9/27/2017 | 23 |
| D | 9/28/2017 | 1 |
| E | 9/8/2017 | 50 |
| E | 6/1/2017 | 1 |
| E | 6/1/2017 | 2 |
| E | 6/5/2017 | 1 |
| E | 6/6/2017 | 1 |
| E | 6/6/2017 | 4 |
| E | 6/7/2017 | 1 |
| E | 6/8/2017 | 1 |
| E | 6/9/2017 | 1 |
| E | 6/13/2017 | 1 |
| E | 6/13/2017 | 4 |
| E | 6/14/2017 | 1 |
| E | 6/15/2017 | 1 |
| E | 6/16/2017 | 1 |
| E | 6/19/2017 | 1 |
| E | 6/20/2017 | 3 |
| E | 6/22/2017 | 1 |
| E | 6/22/2017 | 2 |
| E | 6/23/2017 | 1 |
| E | 6/27/2017 | 3 |
| E | 6/28/2017 | 1 |
| E | 6/29/2017 | 1 |
| A | 6/1/2017 | 3 |
| A | 6/2/2017 | 2 |
| A | 6/5/2017 | 1 |
| A | 6/6/2017 | 1 |
| A | 6/7/2017 | 1 |
| A | 6/8/2017 | 1 |
| A | 6/8/2017 | 5 |
| A | 6/12/2017 | 1 |
| A | 6/12/2017 | 2 |
| A | 6/13/2017 | 1 |
| A | 6/15/2017 | 1 |
| A | 6/16/2017 | 1 |
| A | 6/20/2017 | 1 |
| A | 6/20/2017 | 2 |
| A | 6/21/2017 | 2 |
| A | 6/22/2017 | 2 |
| A | 6/27/2017 | 4 |
| A | 6/27/2017 | 5 |
| A | 6/29/2017 | 1 |
Now what we have to calculate is Productivity of each employee ,which is = Sum(Sheets)/ Total Hours
Here we have to consider 8 hour per day , so 40 in a week excluding weekend.
Let's take Example where A is having Sheets Date entry starting from 1st Sep and till 8th Sep ,see below

So here to calculate productivity =sum(Sheets) is 10 , but Total Hours = All Weekdays*8, which is 168.for whole Sep Month.
Total Hours is independent of any Date entry against Sheets , so for all Months it has to be Weekdays*8 :
June =22 Working days *8 = 176 and in Sep = 21*8 =168
For this first I have created a Master Calendar , which will give me all Dates and then I can use expression :
NetWorkDays(Min(Date), Max(Date))*8
But I'm having one complication in requirement , one of my Employee Name =E , left organization on 8th Of Sep , so only for this employee my Total Hours should be number of working days till 8th Sep = Yellow Marked 5 Days *8=48
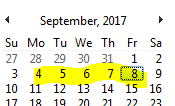
and for rest A,B,C,D Total Hours should remain as Working Day *8 in a Month .
I hope this will help!
Regards,
AS
- « Previous Replies
- Next Replies »