Unlock a world of possibilities! Login now and discover the exclusive benefits awaiting you.
- Qlik Community
- :
- All Forums
- :
- QlikView App Dev
- :
- Expressions with different dimensions in same char...
- Subscribe to RSS Feed
- Mark Topic as New
- Mark Topic as Read
- Float this Topic for Current User
- Bookmark
- Subscribe
- Mute
- Printer Friendly Page
- Mark as New
- Bookmark
- Subscribe
- Mute
- Subscribe to RSS Feed
- Permalink
- Report Inappropriate Content
Expressions with different dimensions in same chart
Hello everbody,
I wanted to know if it is possible in a line chart to have two expressions with different dimensions ?
Common dimensions : Period
1st expression : average of marks by period and by country
2nd expression : average of marks by period for all countries
Thank you
- « Previous Replies
-
- 1
- 2
- Next Replies »
- Mark as New
- Bookmark
- Subscribe
- Mute
- Subscribe to RSS Feed
- Permalink
- Report Inappropriate Content
Hi!
Well, you can achieve that particular effect by making having Period as dimension and then add an expression for each country and an expression for all the countries.
Example:
Expression 1
avg( {<Country{"USA"}>} Marks)
Expression 2
avg( {<Country{"UK"}>} Marks)
Expression 2
avg( {<Country{"*"}>} Marks)
This will show a line for each country and an average for all the countries.
Hope it help!
/Regards
- Mark as New
- Bookmark
- Subscribe
- Mute
- Subscribe to RSS Feed
- Permalink
- Report Inappropriate Content
The problem is that I got numerous lines...
- Mark as New
- Bookmark
- Subscribe
- Mute
- Subscribe to RSS Feed
- Permalink
- Report Inappropriate Content
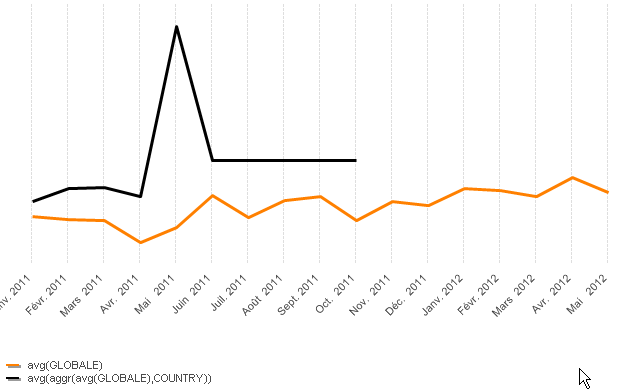
You can try the following:
Chart dimension: Period
1st expression: Avg(Marks)
2nd expression: avg(aggr(avg(Marks),Period, Country))
/Masha
- Mark as New
- Bookmark
- Subscribe
- Mute
- Subscribe to RSS Feed
- Permalink
- Report Inappropriate Content
I got something very strange :

- Mark as New
- Bookmark
- Subscribe
- Mute
- Subscribe to RSS Feed
- Permalink
- Report Inappropriate Content
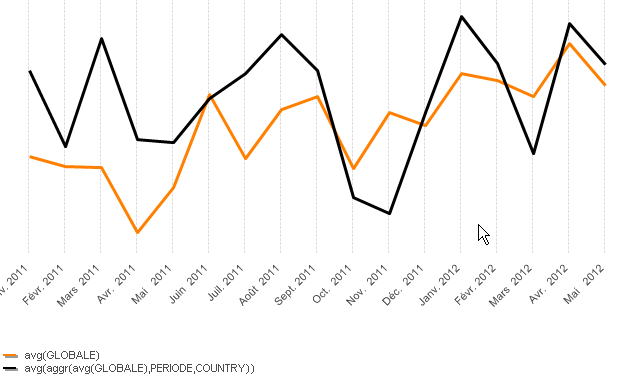
Please add Period dimension to the list of aggregate parameters:
avg(aggr(avg(Marks),Period, Country))
- Mark as New
- Bookmark
- Subscribe
- Mute
- Subscribe to RSS Feed
- Permalink
- Report Inappropriate Content
I tried but it still not working. I don't have my average by country but a global line...

- Mark as New
- Bookmark
- Subscribe
- Mute
- Subscribe to RSS Feed
- Permalink
- Report Inappropriate Content
Hi,
Could you add an example where your solution is working? I would appreciate it alot since it would be neat to reduce the hardcoding
/regards
- Mark as New
- Bookmark
- Subscribe
- Mute
- Subscribe to RSS Feed
- Permalink
- Report Inappropriate Content
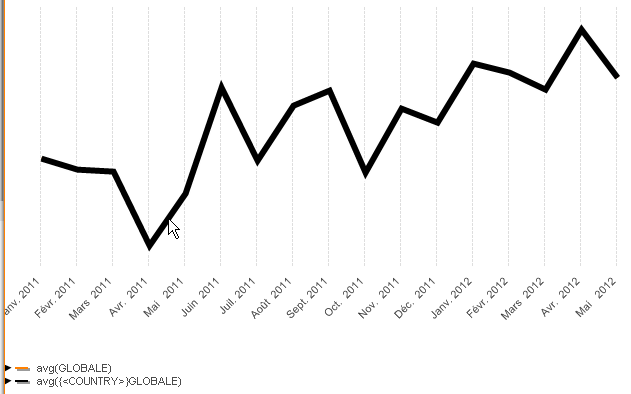
Do you need one line for each country and one line showing global average?
In this case you should have 2 dimensions: Period and Country, and your expressions should be like that:
Global average: avg({<Country>} Mark)
Average by country: avg(Mark)
- Mark as New
- Bookmark
- Subscribe
- Mute
- Subscribe to RSS Feed
- Permalink
- Report Inappropriate Content
It overlaps lines.

- « Previous Replies
-
- 1
- 2
- Next Replies »