Unlock a world of possibilities! Login now and discover the exclusive benefits awaiting you.
Announcements
Introducing Qlik Answers: A plug-and-play, Generative AI powered RAG solution.
READ ALL ABOUT IT!
- Qlik Community
- :
- All Forums
- :
- QlikView App Dev
- :
- Extra information in chart
Options
- Subscribe to RSS Feed
- Mark Topic as New
- Mark Topic as Read
- Float this Topic for Current User
- Bookmark
- Subscribe
- Mute
- Printer Friendly Page
Turn on suggestions
Auto-suggest helps you quickly narrow down your search results by suggesting possible matches as you type.
Showing results for
Creator
2017-10-18
06:53 AM
- Mark as New
- Bookmark
- Subscribe
- Mute
- Subscribe to RSS Feed
- Permalink
- Report Inappropriate Content
Extra information in chart
Hello,
I'm making a bar chart based on a table that contains following columns: YEAR, CUSTOMER_ID, AMOUNT and REGION
| YEAR | CUSTOMER_ID | AMOUNT | REGION |
| 2013 | 071578 | 3712,01 | Region A |
| 2013 | 045079 | 2945,51 | Region B |
| 2013 | 031038 | 2187,72 | Region C |
| 2013 | 062545 | 3946,93 | Region D |
| 2014 | 096286 | 2692,80 | Region A |
| 2014 | 007252 | 2093,59 | Region B |
| 2014 | 067626 | 1806,05 | Region C |
| 2014 | 032590 | 2217,84 | Region D |
| 2015 | 067023 | 2518,96 | Region A |
| 2015 | 041343 | 2290,54 | Region B |
| 2015 | 060776 | 2446,35 | Region C |
| 2015 | 085805 | 2914,27 | Region D |
| 2016 | 005276 | 2676,64 | Region A |
| 2016 | 025726 | 1826,88 | Region B |
| 2016 | 023611 | 2979,45 | Region C |
| 2016 | 029447 | 2115,29 | Region D |
| 2017 | 097230 | 2717,78 | Region A |
| 2017 | 091373 | 2379,84 | Region B |
| 2017 | 005336 | 2147,68 | Region C |
| 2017 | 036325 | 2872,21 | Region D |
The dimensions of the chart are: YEAR and REGION
The expression of the chart is: AMOUNT
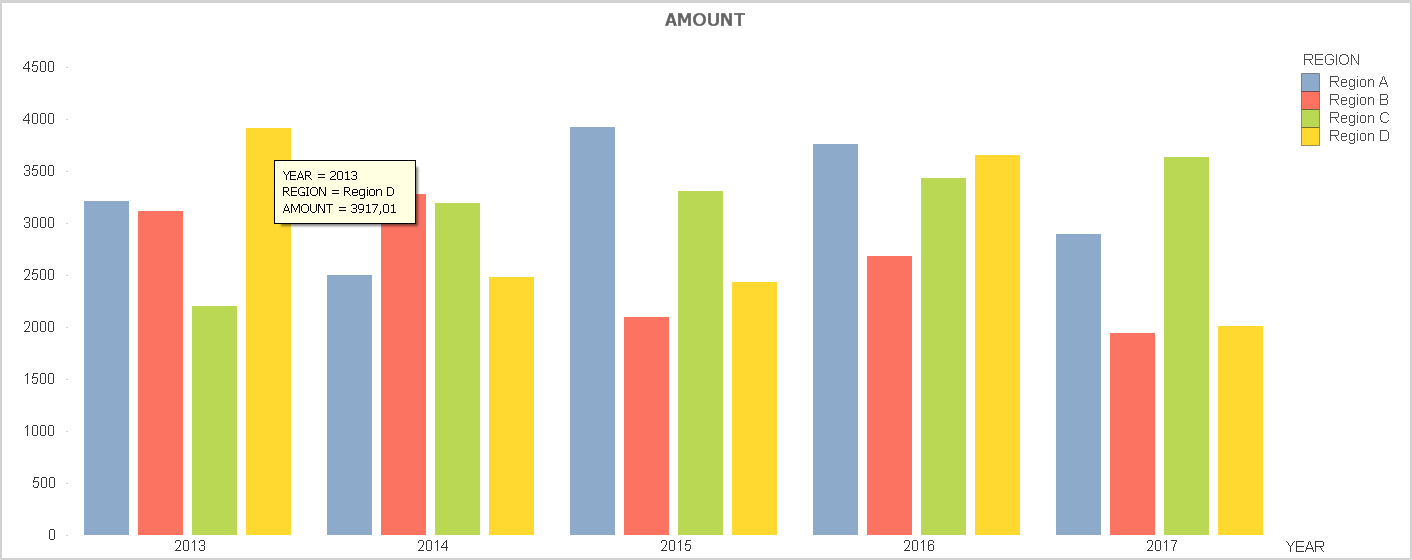
I would like to add the corresponding value of the field CUSTOMER_ID to the tag
so in stead of seeing when over one of the bars
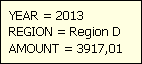
I want to see:
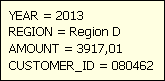
If it is not possible to add CUSTOMER_ID to the tag, an other way to display CUSTOMER_ID in the graph for every bar, is fine too.
I added a qvw as an example.
Thanks
R.W.
1,081 Views
- « Previous Replies
-
- 1
- 2
- Next Replies »
10 Replies
Contributor
2020-06-15
03:11 PM
- Mark as New
- Bookmark
- Subscribe
- Mute
- Subscribe to RSS Feed
- Permalink
- Report Inappropriate Content
How do I do this on QlikSense?
150 Views
- « Previous Replies
-
- 1
- 2
- Next Replies »