Unlock a world of possibilities! Login now and discover the exclusive benefits awaiting you.
- Qlik Community
- :
- All Forums
- :
- QlikView App Dev
- :
- Facing issue in Total in Pivot Chart
- Subscribe to RSS Feed
- Mark Topic as New
- Mark Topic as Read
- Float this Topic for Current User
- Bookmark
- Subscribe
- Mute
- Printer Friendly Page
- Mark as New
- Bookmark
- Subscribe
- Mute
- Subscribe to RSS Feed
- Permalink
- Report Inappropriate Content
Facing issue in Total in Pivot Chart
Hey guys,
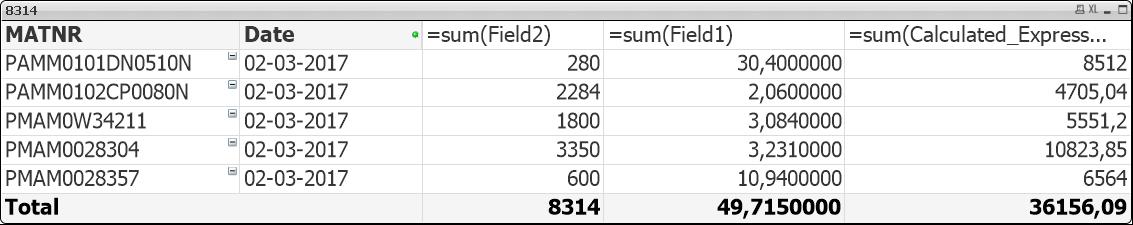
Please find the below Pivot chart table output where i m finding incorrect Total
| Material | Daily Plan To (02-03-2017) |
|---|---|
| PAMM0101DN0510N | 8.512 |
| PAMM0102CP0080N | 4.70504 |
| PMAM0W32111 | |
| PMAM0W34211 | 5.5512 |
| PMAM0101EG3290N | |
| PMAM0028304 | 10.82385 |
| PMAM0028357 | 6.564 |
| PMAM38371DRAW | |
| Total | 413.33051 |
| Total Should be | 36.15609 |
Tried using Dimensionality() in the expression
IF Dimensionality()=0,(sum of the field1 + sum of the existingexpression1)
Even tried using Aggr() on the basis of Material and Date but still total is coming 413.33051 which i wrong.
Please help me to resolve the issue.
Thanks & Regards,
Girish Chhatani
- Tags:
- qlikview developers
Accepted Solutions
- Mark as New
- Bookmark
- Subscribe
- Mute
- Subscribe to RSS Feed
- Permalink
- Report Inappropriate Content
- Mark as New
- Bookmark
- Subscribe
- Mute
- Subscribe to RSS Feed
- Permalink
- Report Inappropriate Content
Hi Girish,
Could you attach a data sample?
In my example "Total" it´s correct.
Regards
Miguel del Valle
- Mark as New
- Bookmark
- Subscribe
- Mute
- Subscribe to RSS Feed
- Permalink
- Report Inappropriate Content
Hi Miguel,
Thanks for the prompt reply.
Please find the attached Excel which contains the sample data along with the Expected Output.
Thanks & Regards,
Girish Chhatani
- Mark as New
- Bookmark
- Subscribe
- Mute
- Subscribe to RSS Feed
- Permalink
- Report Inappropriate Content
Hi Girish,
Your problem is that you aren´t managign '.' and ','; check my example and check output.
- Mark as New
- Bookmark
- Subscribe
- Mute
- Subscribe to RSS Feed
- Permalink
- Report Inappropriate Content
Hi Miguel,
I checked and found once i changed the Chart type to Pivot chart total numbers are changing.
Thanks & Regards,
Girish Chhatani
- Mark as New
- Bookmark
- Subscribe
- Mute
- Subscribe to RSS Feed
- Permalink
- Report Inappropriate Content
see attached
hope this helps
- Mark as New
- Bookmark
- Subscribe
- Mute
- Subscribe to RSS Feed
- Permalink
- Report Inappropriate Content
Hi Girish,
Do you finally solve your question?
Please close your question or tell me if you need something more.
Regards
Miguel del Valle