Unlock a world of possibilities! Login now and discover the exclusive benefits awaiting you.
- Qlik Community
- :
- All Forums
- :
- QlikView App Dev
- :
- Filtering on a calculated dimension
- Subscribe to RSS Feed
- Mark Topic as New
- Mark Topic as Read
- Float this Topic for Current User
- Bookmark
- Subscribe
- Mute
- Printer Friendly Page
- Mark as New
- Bookmark
- Subscribe
- Mute
- Subscribe to RSS Feed
- Permalink
- Report Inappropriate Content
Filtering on a calculated dimension
Hi All,
I am looking to see if someone can help understand how filtering on a calculated dimension works. Right now I have 3 fields: Attr1, Attr2, and Attr3. I want to create a filter that is 1 when all three meet a certain criteria, and 0 when not (SEE ATTACHMENT). Hence I create a listbox whose expression is =if(Attr1='Y' or Attr2='T' or Attr2='V' or Attr3='3',1,0). However, when I click "1", no observations leave the analysis. There are clearly cases where this condition does not hold (observations 13,14,16,17,19,20), Even stranger, when I create a chart with dimension as that expression and count(Obs), the number comes out right. Any suggestions?
- « Previous Replies
-
- 1
- 2
- Next Replies »
- Mark as New
- Bookmark
- Subscribe
- Mute
- Subscribe to RSS Feed
- Permalink
- Report Inappropriate Content
Hi Jesse,
There is some overlap in the conditions of your calculated dimension e.g. in come cases the selections could return both a 1 or 0 because of the relationships between Attr1, Attr2 and Attr3.
You may need to review this calculated expression and replace OR with AND eg:
=if(Attr1='Y' and (Attr2='T' or Attr2='V') and Attr3='3',1,0)
Hope this helps.
Rod
- Mark as New
- Bookmark
- Subscribe
- Mute
- Subscribe to RSS Feed
- Permalink
- Report Inappropriate Content
If you are selecting in a chart or list box with the calculated dimension, you are not selecting the records (primary key obs), but the field values of the fields used in the calculated dimension.
In your case, when you filtering on zero, you will see it work as expected. If you select 1, you would expect to see this table:
| Obs | Attr1 | Attr2 | Attr3 |
|---|---|---|---|
| 1 | Y | T | 1 |
| 2 | N | V | 2 |
| 3 | Y | T | 3 |
| 4 | Y | T | 4 |
| 5 | Y | T | 1 |
| 6 | N | V | 2 |
| 7 | N | V | 3 |
| 8 | Y | T | 4 |
| 9 | Y | T | 1 |
| 10 | Y | T | 2 |
| 11 | Y | T | 3 |
| 12 | N | V | 4 |
| 15 | N | N | 3 |
| 19 | N | N | 3 |
As you see, all Attr fields show all possible field values. Thats's what is being selected when selecting 1 in your list box, all values in Attr1, all values in Attr2, all values in Attr3. Unfortunately, as you can see, this won't filter off the zeor flagged values anymore.
To do so, you need to let QV filter on a primary key. Use this as calculated dimension in your chart:
=aggr( if(Attr1='Y' or Attr2='T' or Attr2='V' or Attr3='3',1,0),Obs)
- Mark as New
- Bookmark
- Subscribe
- Mute
- Subscribe to RSS Feed
- Permalink
- Report Inappropriate Content
As I understand your answer, what you need to do is create a temporary table where, at the obs level, we calculate the condition, then filter on that temp table. I think this makes sense. It's still a little weird to me that the above does not work.
- Mark as New
- Bookmark
- Subscribe
- Mute
- Subscribe to RSS Feed
- Permalink
- Report Inappropriate Content
Well I think Stefan's explanation put it well. The calculated dimension is a transient and exists only when the chart is calculated, so there is no way to store a selection on the calculated dimension, nor any way to communicate that selection to all the other sheet objects. It is the same with expressions. Either way, the selection is made in the underlying dimensions in the data model. That way the selection persists and applies to all objects.
You could define a derived field in your load script:
LOAD
...
=if(Attr1='Y' or Attr2='T' or Attr2='V' or Attr3='3',1,0) As Flag
...
Now use Flag as the dimension and make selections...
- Mark as New
- Bookmark
- Subscribe
- Mute
- Subscribe to RSS Feed
- Permalink
- Report Inappropriate Content
I agree that selecting on calculated dimensions (and similar apply to multiple dimensions in a chart) might not be intuitive, since people tend to assume they made selections on the specific combination of dimension values (if they assume selections on dimension value at all - many tend to assume they've selected expression values)
But as discussed above, that's not the case.
As Jonathan showed, creating a flag in the data model would be the best solution, but that's not always possible, when you want dynamic dimensions.
And I also understood your OP, that you are trying to understand the inner logic of the selections, not to look essentially for a workaround.
If this is true, is it now somewhat clear how the selections are made on calculated dimensions?
- Mark as New
- Bookmark
- Subscribe
- Mute
- Subscribe to RSS Feed
- Permalink
- Report Inappropriate Content
Dear Stefan
I've got a similar issue which will not work.
I have a straigth table with a calculatet expression.
The same expression I will use as a calculatet dimension.
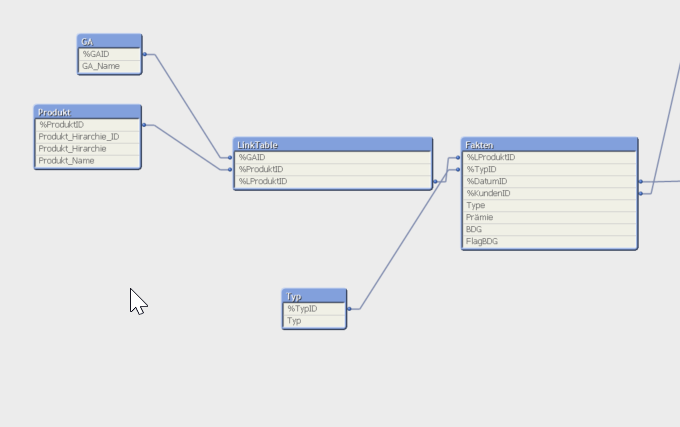
Expression: =sum(BDG)/count(DISTINCT %TypID)/count(DISTINCT %LProduktID)
Dimension:
=aggr(if((sum(BDG)/count(DISTINCT %TypID)/count(DISTINCT %LProduktID))>vPlanBDG, '▲',
if((sum(BDG)/count(DISTINCT %TypID)/count(DISTINCT %LProduktID)) <vPlanBDG, '▼','►')),Produkt_Name,Typ)
vPlanBDG is just a number, as an example 104. So it puts the right Symbols if above under or equal, I tried it also with the number as a result which would be:
=aggr(sum(BDG)/count(DISTINCT %TypID)/count(DISTINCT %LProduktID),Produkt_Name,Typ)
The Problem is, everything looks fine, but the filter, I mean choosing the dimension does not exclude all lets say above value, neither if I choose the version whith numbers....
Moreover, if I habe choosen the dimension, and qlik it again to get back, it does not work either...
I built a reset button, but this is not user friendly...
any idea or you Need some more inputs?
by the way, the same table, but just with one more dimension, in this case Produkt_Name, works perfectly.
Thank you very much for your help.
- Mark as New
- Bookmark
- Subscribe
- Mute
- Subscribe to RSS Feed
- Permalink
- Report Inappropriate Content
Have you tried using a prímary key, e.g. create a key made of Produkt_Name and Typ in your script:
LOAD
Produkt_Name,
Typ,
AutonumberHash256(Produkt_Name, Typ) as ProduktNameTypKey,
...
Then use this key in your calculated dimension.
- Mark as New
- Bookmark
- Subscribe
- Mute
- Subscribe to RSS Feed
- Permalink
- Report Inappropriate Content
Thank you for your quick Reply.
Produkt_Name and Typ are in 2 different Dimensions in my Datamodell, so I think this would not work.
- Mark as New
- Bookmark
- Subscribe
- Mute
- Subscribe to RSS Feed
- Permalink
- Report Inappropriate Content
Could be a combined key of %ProduktID and %TypID in your Fakten table, though not 100% sure (is Produkt_Name showing a 1:1 relation to %ProduktID?).
- « Previous Replies
-
- 1
- 2
- Next Replies »