Unlock a world of possibilities! Login now and discover the exclusive benefits awaiting you.
- Qlik Community
- :
- All Forums
- :
- QlikView App Dev
- :
- Re: Facts vs Budget - Budget not available in Futu...
- Subscribe to RSS Feed
- Mark Topic as New
- Mark Topic as Read
- Float this Topic for Current User
- Bookmark
- Subscribe
- Mute
- Printer Friendly Page
- Mark as New
- Bookmark
- Subscribe
- Mute
- Subscribe to RSS Feed
- Permalink
- Report Inappropriate Content
Facts vs Budget - Budget not available in Future
Hello experts,
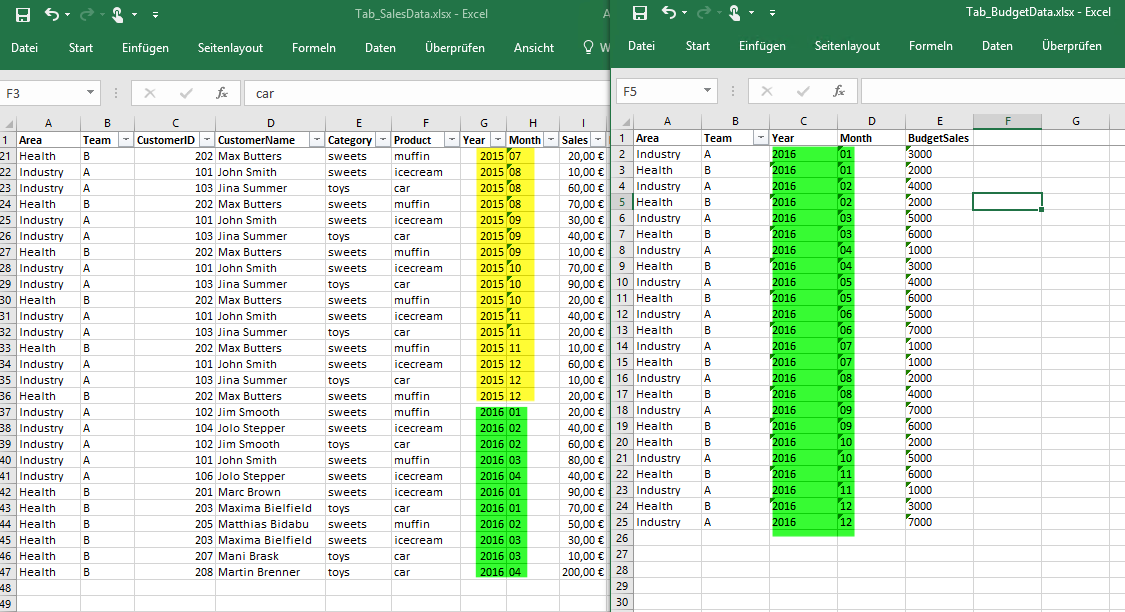
I’ve got facts data (sales) and budget data.
The facts (sales) of 2015 are available from January untill December.
The facts (sales) of 2016 are available from January untill the current month, which is April.
The budget data is available for 2016 from January untill December.

The requirement:
The customer wants to see the sales 2015, sales 2016 and budget 2016 in the same table.
My issue is, that I cannot view the budget data of 2016 in the table, which lays in future – after April (red).

It is because of the link between the facts & budget data. I just cannot figure it out how to solve this issue.
I want to see ALL BUDGET data of 2016 ...
All relevant files, to play with, are attached.
Does anyone have any idea for this “standard” requirement?
Regards
Nik
Accepted Solutions
- Mark as New
- Bookmark
- Subscribe
- Mute
- Subscribe to RSS Feed
- Permalink
- Report Inappropriate Content
Try to do it like this :
SalesDataTab:
LOAD
Area & Team & Year & Month as %Key_AreaTeamYearMonth,
Area ,
Team ,
CustomerID ,
CustomerName ,
Category ,
Product ,
Year ,
Month ,
Year & Month as YearMonth,
Sales as SalesData_Sales,
Profit as SalesData_Profit,
'Sales' as Table
FROM
Tab_SalesData.xlsx
(ooxml, embedded labels, table is Tab1);
Concatenate
BudgetDataTab:
LOAD
Area & Team & Year & Month as %Key_AreaTeamYearMonth,
Area ,
Team ,
Year ,
Month ,
Year & Month as YearMonth,
BudgetSales as BudgetData_BudgetSales,
'Budget' as Table
FROM
Tab_BudgetData.xlsx
(ooxml, embedded labels, table is Tab1);
Concatenate is standard as mention above.
- Mark as New
- Bookmark
- Subscribe
- Mute
- Subscribe to RSS Feed
- Permalink
- Report Inappropriate Content
What if you leave the two tables disconnected?
Use this expression for Budget amount:
Aggr(If(SalesData_Month = BudgetData_Month, (SUM({<SalesData_Year = {"$(=$(v_YCurr))"}>} BudgetData_BudgetSales))), BudgetData_Month, SalesData_Month)
- Mark as New
- Bookmark
- Subscribe
- Mute
- Subscribe to RSS Feed
- Permalink
- Report Inappropriate Content
I would concat the sales and budget tables--- i think that is the "standard" way to do it.
- Mark as New
- Bookmark
- Subscribe
- Mute
- Subscribe to RSS Feed
- Permalink
- Report Inappropriate Content
Try to do it like this :
SalesDataTab:
LOAD
Area & Team & Year & Month as %Key_AreaTeamYearMonth,
Area ,
Team ,
CustomerID ,
CustomerName ,
Category ,
Product ,
Year ,
Month ,
Year & Month as YearMonth,
Sales as SalesData_Sales,
Profit as SalesData_Profit,
'Sales' as Table
FROM
Tab_SalesData.xlsx
(ooxml, embedded labels, table is Tab1);
Concatenate
BudgetDataTab:
LOAD
Area & Team & Year & Month as %Key_AreaTeamYearMonth,
Area ,
Team ,
Year ,
Month ,
Year & Month as YearMonth,
BudgetSales as BudgetData_BudgetSales,
'Budget' as Table
FROM
Tab_BudgetData.xlsx
(ooxml, embedded labels, table is Tab1);
Concatenate is standard as mention above.
- Mark as New
- Bookmark
- Subscribe
- Mute
- Subscribe to RSS Feed
- Permalink
- Report Inappropriate Content
Or create a link table containing four dimension fields (Team, Area, Month, Year) and two keys: one that connects to the Facts table, and another one that connects to the Budget table. The key values are composed of the values in the other dimension fields, like
:
Area & '|' & Team & '|' & Year & '|' & Month AS BudgetKey,
Area & '|' & Team & '|' & Year & '|' & Month AS ActualsKey,
:
Make sure that all future periods are listed in this Link table as well. A cartesian JOIN of your PeriodCalendar to all Area & Team values will do the job.
- Mark as New
- Bookmark
- Subscribe
- Mute
- Subscribe to RSS Feed
- Permalink
- Report Inappropriate Content
I would say: Sunny 4 president ; )
Your solution does exactly the trick!!!
It seems a bit strange to me, still ; )
I'm going to check out other sugestions, too. But for anyone who might read this post having the similar issue - sunny's idea works. I do not see any issue, which might occur by using the provided solution
@ all experts: do you believe it might cause some issues or is it really just THAT simple ![]()
- Mark as New
- Bookmark
- Subscribe
- Mute
- Subscribe to RSS Feed
- Permalink
- Report Inappropriate Content
Hi Alex,
your solution did work, too.
I've uploaded the ready to use file for the community.