Unlock a world of possibilities! Login now and discover the exclusive benefits awaiting you.
- Qlik Community
- :
- All Forums
- :
- QlikView App Dev
- :
- Field matching
- Subscribe to RSS Feed
- Mark Topic as New
- Mark Topic as Read
- Float this Topic for Current User
- Bookmark
- Subscribe
- Mute
- Printer Friendly Page
- Mark as New
- Bookmark
- Subscribe
- Mute
- Subscribe to RSS Feed
- Permalink
- Report Inappropriate Content
Field matching
Hello All,
I have two table:
TableA:
Load A,
B,
C
Code;
SQL Select *
From SourceA
Info in table A:
| A | B | C |
|---|---|---|
| AP001 | AP002 | AP001 |
| AP003 | AP004 | AP005 |
| AP005 | AP001 | AP006 |
| AP010 | AP007 | AP008 |
TableB contains the meaning of the the "APXXX" codes.
TableB,
Load * inline
[Code , Codification , Recomendation , Top5
AP001, Blue, Black , Yellow
AP002, Green, Pink, Pink
AP003, Brown, Red, Blue
ETC....................]
I need to create a table like the below:
| A | Codification | Recommendation | Top5 | B | Codification | Recommendation | Top5 | C | Codification |
|---|---|---|---|---|---|---|---|---|---|
| AP001 | Blue | Black | Yellow | AP002 | Green | Pink | Pink | AP001 | Blue |
| AP002 | Green | Pink | Pink | ||||||
| AP003 | Brown | Red | Blue |
Any idea on how to create it?
Thanks,
Accepted Solutions
- Mark as New
- Bookmark
- Subscribe
- Mute
- Subscribe to RSS Feed
- Permalink
- Report Inappropriate Content
Here's one attempt - Load like this:
TableA:
Load A, B, C
Inline
[
A, B, C
AP001, AP002, AP001
AP003, AP004, AP005
AP005, AP001, AP006
AP010, AP007, AP008
];


TableB:
Load *
Inline
[
Code , Codification , Recomendation , Top5
AP001, Blue, Black , Yellow
AP002, Green, Pink, Pink
AP003, Brown, Red, Blue
];


T1:
LOAD A As Code,
  'A' As Group,
  RecNo() As Row
Resident TableA;


LOAD B As Code,
  'B' As Group,
  RecNo() As Row
Resident TableA;


LOAD C As Code,
  'C' As Group,
  RecNo() As Row
Resident TableA;


Drop Table TableA;
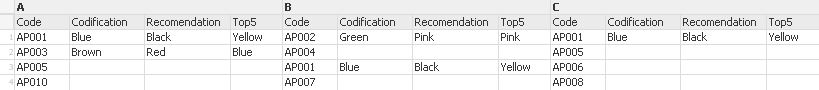
Next, create a pivot table with Row and Group as dimensions and the following expressions:
Code: =MinString(Code)
Codification = MinString(Codification)
Recomendation: =MinString(Recomendation)
Top5: =MinString(Top5)
Drag the Group Dimension to the top of the chart and make the first column as small as possible. Enter a single space as the label for both dimensions and make the null symbol a space. With a little custom formatting:
- Mark as New
- Bookmark
- Subscribe
- Mute
- Subscribe to RSS Feed
- Permalink
- Report Inappropriate Content
use left join
- Mark as New
- Bookmark
- Subscribe
- Mute
- Subscribe to RSS Feed
- Permalink
- Report Inappropriate Content
you can use Left or Inner join based on requirement, something like this?
TableA:
Load A as Code,
B,
C;
// Code; //Comment it
SQL Select *
From SourceA
left join(TableA) or inner join(TableA)
TableB,
Load * inline
[Code , Codification , Recomendation , Top5
AP001, Blue, Black , Yellow
AP002, Green, Pink, Pink
AP003, Brown, Red, Blue
ETC....................]
- Mark as New
- Bookmark
- Subscribe
- Mute
- Subscribe to RSS Feed
- Permalink
- Report Inappropriate Content
Could you upload "Code" field data in Table A?
- Mark as New
- Bookmark
- Subscribe
- Mute
- Subscribe to RSS Feed
- Permalink
- Report Inappropriate Content
how does that table A related to table B i.e. based on the code ? because even the column A,B,C also has the similar values ....do you need to map for each column values or you need to map with only one field
- Mark as New
- Bookmark
- Subscribe
- Mute
- Subscribe to RSS Feed
- Permalink
- Report Inappropriate Content
Here's one attempt - Load like this:
TableA:
Load A, B, C
Inline
[
A, B, C
AP001, AP002, AP001
AP003, AP004, AP005
AP005, AP001, AP006
AP010, AP007, AP008
];


TableB:
Load *
Inline
[
Code , Codification , Recomendation , Top5
AP001, Blue, Black , Yellow
AP002, Green, Pink, Pink
AP003, Brown, Red, Blue
];


T1:
LOAD A As Code,
  'A' As Group,
  RecNo() As Row
Resident TableA;


LOAD B As Code,
  'B' As Group,
  RecNo() As Row
Resident TableA;


LOAD C As Code,
  'C' As Group,
  RecNo() As Row
Resident TableA;


Drop Table TableA;
Next, create a pivot table with Row and Group as dimensions and the following expressions:
Code: =MinString(Code)
Codification = MinString(Codification)
Recomendation: =MinString(Recomendation)
Top5: =MinString(Top5)
Drag the Group Dimension to the top of the chart and make the first column as small as possible. Enter a single space as the label for both dimensions and make the null symbol a space. With a little custom formatting:
- Mark as New
- Bookmark
- Subscribe
- Mute
- Subscribe to RSS Feed
- Permalink
- Report Inappropriate Content
Thanks everyone.
The answer of Jonathan works. 🙂 thanks