Unlock a world of possibilities! Login now and discover the exclusive benefits awaiting you.
- Qlik Community
- :
- All Forums
- :
- QlikView App Dev
- :
- FieldIndex values change after updating data set?
- Subscribe to RSS Feed
- Mark Topic as New
- Mark Topic as Read
- Float this Topic for Current User
- Bookmark
- Subscribe
- Mute
- Printer Friendly Page
- Mark as New
- Bookmark
- Subscribe
- Mute
- Subscribe to RSS Feed
- Permalink
- Report Inappropriate Content
FieldIndex values change after updating data set?
Hi everyone
I have a problem with understanding how the FieldIndex-funcion works.
I have made a QV-application, where I used a line chart to show some data based on a variable faculty.
The variable always has 5 different values - because of 5 faculties.
In the colors tab in the line chart I used my predefines colors to control the colors:
$(vGrafFarve1), $(vGrafFarve2),...,$(vGrafFarve5)
I also used the "use persistent colors" to make sure, that the faculties hold their value, when filtering the data on faculty in a list box.
When I made the application I noticed that the faculty of ex. humanities always had the value of $(vGrafFarve2).
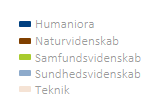
Therefore I could make this categorization to my line charts:
(The dots hold the calculated colors $(vGrafFarve1),...,$(vGrafFarve5)).
Now I'm updating the application with the newest data and find that the colors in the line charts doesn't match my categories shown above any longer?
I have read that it has something to do with how Qlikview reads the dimension values.
I checked the FieldIndex value on my 5 faculty values in the faculty variable before and after the update of the application.
I found that 3 of the 5 values had changed Fieldindex value, which obviously explains why my categorization doesn't match the colors in the line charts any longer.
But now I would like to understand my the FieldIndex values changed, just because I loaded data for the newest year into the application? The faculty variable still only has 5 different values - and they still have the same names?
I would like to understand it, so I don't have the same problem the next time I have to update the application.
Kind regards
Maria