Unlock a world of possibilities! Login now and discover the exclusive benefits awaiting you.
- Qlik Community
- :
- All Forums
- :
- QlikView App Dev
- :
- Re: Filter. Min value or/and all except certain va...
- Subscribe to RSS Feed
- Mark Topic as New
- Mark Topic as Read
- Float this Topic for Current User
- Bookmark
- Subscribe
- Mute
- Printer Friendly Page
- Mark as New
- Bookmark
- Subscribe
- Mute
- Subscribe to RSS Feed
- Permalink
- Report Inappropriate Content
Filter. Min value or/and all except certain values
Good day,
I need help with using filters. In my case, I have a chart with X-axis Amount and Y-axis Price. I sorted Amount by Price. But now, I want to filter my data by:
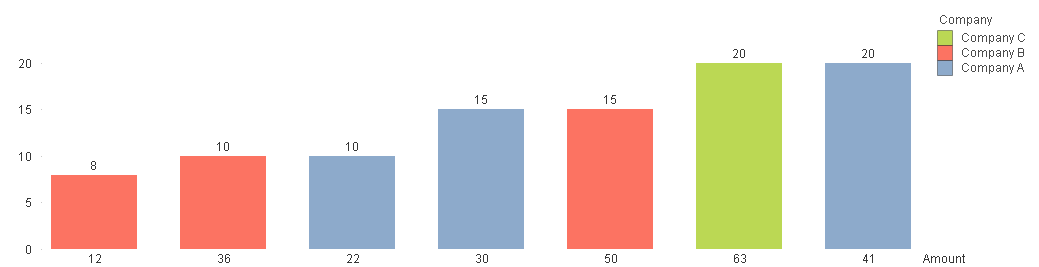
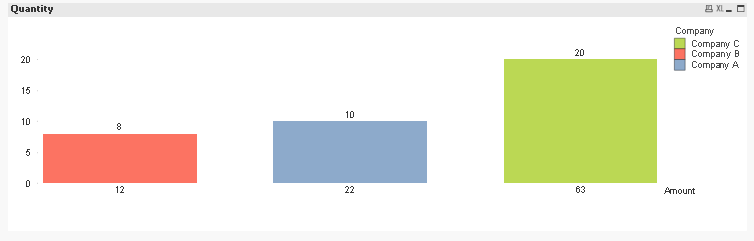
1) showing the only amount of minimum price for each company separately. For example, it would be 8/12 for Company B, 10/22 for Company A and 20/63 Company C.
2) ability to choose certain values or all values except certain. For example, display each company's first 2 lowest price amounts (Company B 8/12 and 10/36; Company A 10/22 and 15/30; Company C 20/63).
Message was edited by: Vidmat Vidmat
- « Previous Replies
-
- 1
- 2
- Next Replies »
- Mark as New
- Bookmark
- Subscribe
- Mute
- Subscribe to RSS Feed
- Permalink
- Report Inappropriate Content
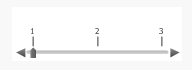
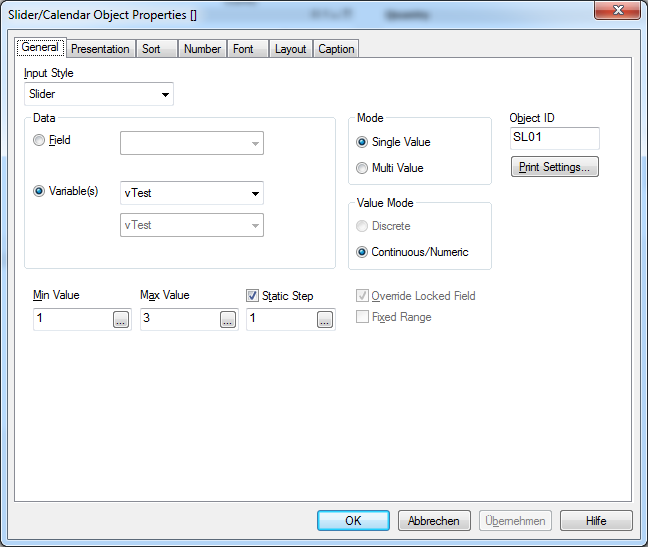
swuehl , could you explain to me how to create a slider object to set a variable to 1, 2, 3, please?
- Mark as New
- Bookmark
- Subscribe
- Mute
- Subscribe to RSS Feed
- Permalink
- Report Inappropriate Content
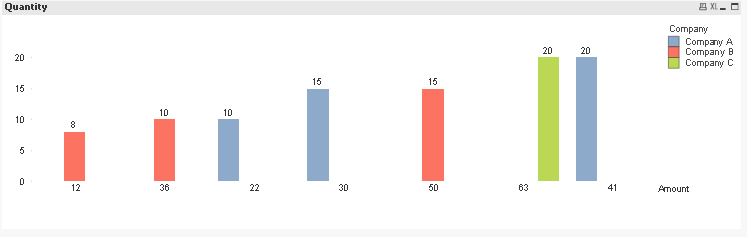
This is your original bar chart:
I created a variable vTest and a slider object:
And adding the expression to your chart returned
- Mark as New
- Bookmark
- Subscribe
- Mute
- Subscribe to RSS Feed
- Permalink
- Report Inappropriate Content
swuehl, thanks. It works.
- « Previous Replies
-
- 1
- 2
- Next Replies »