Unlock a world of possibilities! Login now and discover the exclusive benefits awaiting you.
- Qlik Community
- :
- All Forums
- :
- QlikView App Dev
- :
- Find minimum &max ranked to use in text box
- Subscribe to RSS Feed
- Mark Topic as New
- Mark Topic as Read
- Float this Topic for Current User
- Bookmark
- Subscribe
- Mute
- Printer Friendly Page
- Mark as New
- Bookmark
- Subscribe
- Mute
- Subscribe to RSS Feed
- Permalink
- Report Inappropriate Content
Find minimum &max ranked to use in text box
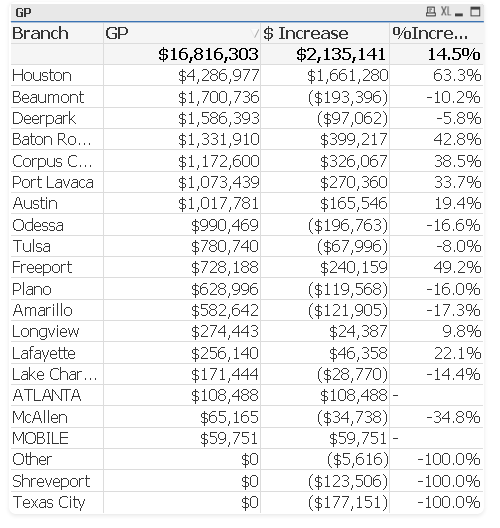
Below is a table of data that I've loade in to a QVW:

I need to have a couple of text boxes showing various peices of info - namely, the top ranked 'Branch', with it's 'GP', and the other two fields - each in it's own text box.
In addition, I'll need the lowest ranked 'Branch', and it's associated fields.
I've got an expression using Rank() to pick the highest ranked Branch, but I'm not sure how to pick the lowest (based on GP or $ Increase):
=aggr(if(rank(sum({1<PeriodYear = {2013}>} GP))<=1,Branch),Branch)
Thanks for your help!
S.
- Mark as New
- Bookmark
- Subscribe
- Mute
- Subscribe to RSS Feed
- Permalink
- Report Inappropriate Content
Hi Sam,
Try this =aggr(if(-rank(sum({1<PeriodYear = {2013}>} GP))<=1,Branch),Branch)
- Mark as New
- Bookmark
- Subscribe
- Mute
- Subscribe to RSS Feed
- Permalink
- Report Inappropriate Content
Jeroen,
thanks, I'll try it - one other question - can this expression be used as part of a set analysis expression?
Such as:
=sum({<Branch = aggr(if(-rank(sum({1<PeriodYear = {2013}>} GP))<=1,Branch),Branch)>} $ Increase)
Sam
- Mark as New
- Bookmark
- Subscribe
- Mute
- Subscribe to RSS Feed
- Permalink
- Report Inappropriate Content
Sorry, putting a minus sign in front of Rank() didn't work -
S.
- Mark as New
- Bookmark
- Subscribe
- Mute
- Subscribe to RSS Feed
- Permalink
- Report Inappropriate Content
However, putting a minus in from of sum() did, somewhat. But because I have three Branches that have $0.00 GP, I don't get anything displayed in the text field unless I do a CONCAT().
I'll have to see if I can use the expression for $ Increase and% Increase...
S.
- Mark as New
- Bookmark
- Subscribe
- Mute
- Subscribe to RSS Feed
- Permalink
- Report Inappropriate Content
Try negating the sum.
And for your other question:
Maybe like this:
=sum({<Branch = {"=rank(sum({1<PeriodYear = {2013} >} GP)=1"} >} [$ Increase])
- Mark as New
- Bookmark
- Subscribe
- Mute
- Subscribe to RSS Feed
- Permalink
- Report Inappropriate Content
Sorry Swuehl was wright. You should negative the Sum and not the Rank.