Unlock a world of possibilities! Login now and discover the exclusive benefits awaiting you.
- Qlik Community
- :
- All Forums
- :
- QlikView App Dev
- :
- Re: Find the first day's data of each month/quarte...
- Subscribe to RSS Feed
- Mark Topic as New
- Mark Topic as Read
- Float this Topic for Current User
- Bookmark
- Subscribe
- Mute
- Printer Friendly Page
- Mark as New
- Bookmark
- Subscribe
- Mute
- Subscribe to RSS Feed
- Permalink
- Report Inappropriate Content
Find the first day's data of each month/quarter
Hello,
I have a table which has a field Date. I now want to display the data of the first day of each month or quarter. However, some dates are missing. For example, I don't have data on 01/01/2017 but I have data on 01/02/2017. In this case I want to display data of 01/02/2017. Can anyone tell me how to do it?
Thanks in advance,
Mandi
- « Previous Replies
-
- 1
- 2
- Next Replies »
- Mark as New
- Bookmark
- Subscribe
- Mute
- Subscribe to RSS Feed
- Permalink
- Report Inappropriate Content
Is this needed in a chart or are you looking to do this in the script? If it is in a chart, what all dimensions do you have? Can you may be share a sample?
- Mark as New
- Bookmark
- Subscribe
- Mute
- Subscribe to RSS Feed
- Permalink
- Report Inappropriate Content
Hi, thanks for replying!
Suppose I have data below:
| Date | Aged Value | Non-Aged Value |
| 1/1/2017 | 20.31 | 54.5 |
| 1/2/2017 | 20.35 | 54.67 |
| 1/3/2017 | 20.39 | 54.84 |
| 1/4/2017 | 20.43 | 55.01 |
| 2/2/2017 | 21.46 | 66.77 |
| 2/4/2017 | 27.19 | 56.9 |
| 2/5/2017 | 32.92 | 47.03 |
| 2/6/2017 | 38.65 | 37.16 |
| 2/7/2017 | 44.38 | 27.29 |
| 3/1/2017 | 21.02 | 36.56 |
| 3/2/2017 | 27.19 | 56.9 |
| 3/3/2017 | 33.36 | 77.24 |
| 3/4/2017 | 39.53 | 97.58 |
| 3/5/2017 | 45.7 | 117.92 |
| 4/3/2017 | 23.45 | 58.76 |
| 4/4/2017 | 33.36 | 77.24 |
| 4/5/2017 | 43.27 | 95.72 |
| 4/6/2017 | 53.18 | 114.2 |
And I want to have a bar chart like below (only display the data of the first existing date in a month in the table):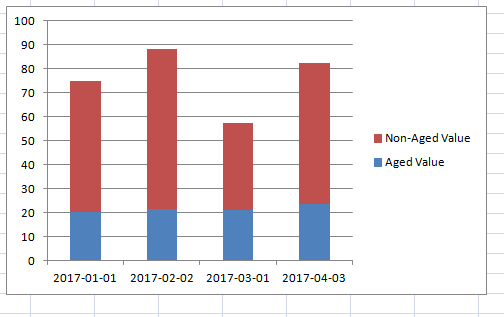
I have created a dimension with expression:
if (num(right(MyDateField, 2)) = 1, Date(MyDateField, 'YYYY-MM-DD'))
However, it will leave out Feb and April data because the existing first date of these two months is not 02-01/04-01.
Thanks,
Mandi
- Mark as New
- Bookmark
- Subscribe
- Mute
- Subscribe to RSS Feed
- Permalink
- Report Inappropriate Content
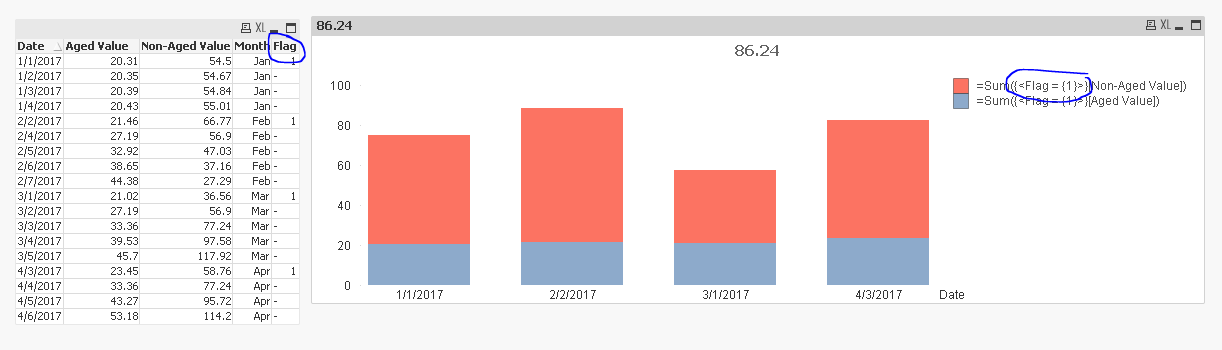
Create a flag in the script
Table:
LOAD *,
Month(Date) as Month;
LOAD * INLINE [
Date, Aged Value, Non-Aged Value
1/1/2017, 20.31, 54.5
1/2/2017, 20.35, 54.67
1/3/2017, 20.39, 54.84
1/4/2017, 20.43, 55.01
2/2/2017, 21.46, 66.77
2/4/2017, 27.19, 56.9
2/5/2017, 32.92, 47.03
2/6/2017, 38.65, 37.16
2/7/2017, 44.38, 27.29
3/1/2017, 21.02, 36.56
3/2/2017, 27.19, 56.9
3/3/2017, 33.36, 77.24
3/4/2017, 39.53, 97.58
3/5/2017, 45.7, 117.92
4/3/2017, 23.45, 58.76
4/4/2017, 33.36, 77.24
4/5/2017, 43.27, 95.72
4/6/2017, 53.18, 114.2
];
Left Join (Table)
LOAD Month,
Min(Date) as Date,
1 as Flag
Resident Table
Group By Month;
And then use this flag as set analysis
- Mark as New
- Bookmark
- Subscribe
- Mute
- Subscribe to RSS Feed
- Permalink
- Report Inappropriate Content
Hi Sunny,
It works well with INLINE statement. How can I do this when I have to load data by using SQL?
Thank you very much,
Mandi
- Mark as New
- Bookmark
- Subscribe
- Mute
- Subscribe to RSS Feed
- Permalink
- Report Inappropriate Content
May be like this
Table:
LOAD *,
Month(Date) as Month;
SQL SELECT
Date,
[Aged Value],
[Non-Aged Value]
FROM XYZ_TABLE;
Left Join (Table)
LOAD Month,
Min(Date) as Date,
1 as Flag
Resident Table
Group By Month;
- Mark as New
- Bookmark
- Subscribe
- Mute
- Subscribe to RSS Feed
- Permalink
- Report Inappropriate Content
It says cannot find field <Month>.
- Mark as New
- Bookmark
- Subscribe
- Mute
- Subscribe to RSS Feed
- Permalink
- Report Inappropriate Content
How are you doing it 
- Mark as New
- Bookmark
- Subscribe
- Mute
- Subscribe to RSS Feed
- Permalink
- Report Inappropriate Content
Here is my scripts:
LIB CONNECT TO 'Database';
qualify *;
[Visual]:
LOAD
Brand,
Site,
Location,
Item,
Description,
"Unit Price",
"Age",
Inventory,
"VALUE",
"Report Date",
month("Report Date") as Month;
SQL SELECT
Brand,
Site,
Location,
Item,
Description,
"Unit Price",
"Age",
Inventory,
"VALUE",
"Report Date"
FROM "Database.Table"
where Brand = 'xxx';
Left Join(Visual)
LOAD Month,
Min("Report Date") as [Report Date],
1 as Flag
Resident Visual
Group By Month;
The error occurs from Left Join.
Thanks for your help!
- Mark as New
- Bookmark
- Subscribe
- Mute
- Subscribe to RSS Feed
- Permalink
- Report Inappropriate Content
This is because you are using Qualify *;... do you need this?
- « Previous Replies
-
- 1
- 2
- Next Replies »