Unlock a world of possibilities! Login now and discover the exclusive benefits awaiting you.
- Qlik Community
- :
- All Forums
- :
- QlikView App Dev
- :
- Re: Finding Max, Min and Average Value in a Quarte...
- Subscribe to RSS Feed
- Mark Topic as New
- Mark Topic as Read
- Float this Topic for Current User
- Bookmark
- Subscribe
- Mute
- Printer Friendly Page
- Mark as New
- Bookmark
- Subscribe
- Mute
- Subscribe to RSS Feed
- Permalink
- Report Inappropriate Content
Finding Max, Min and Average Value in a Quarter
Hello Community,
Found a similar thread on the community and applied the solution available on the community. but my requirement is bit different and not able to apply this logic to solve my issue and need assistance. Please help
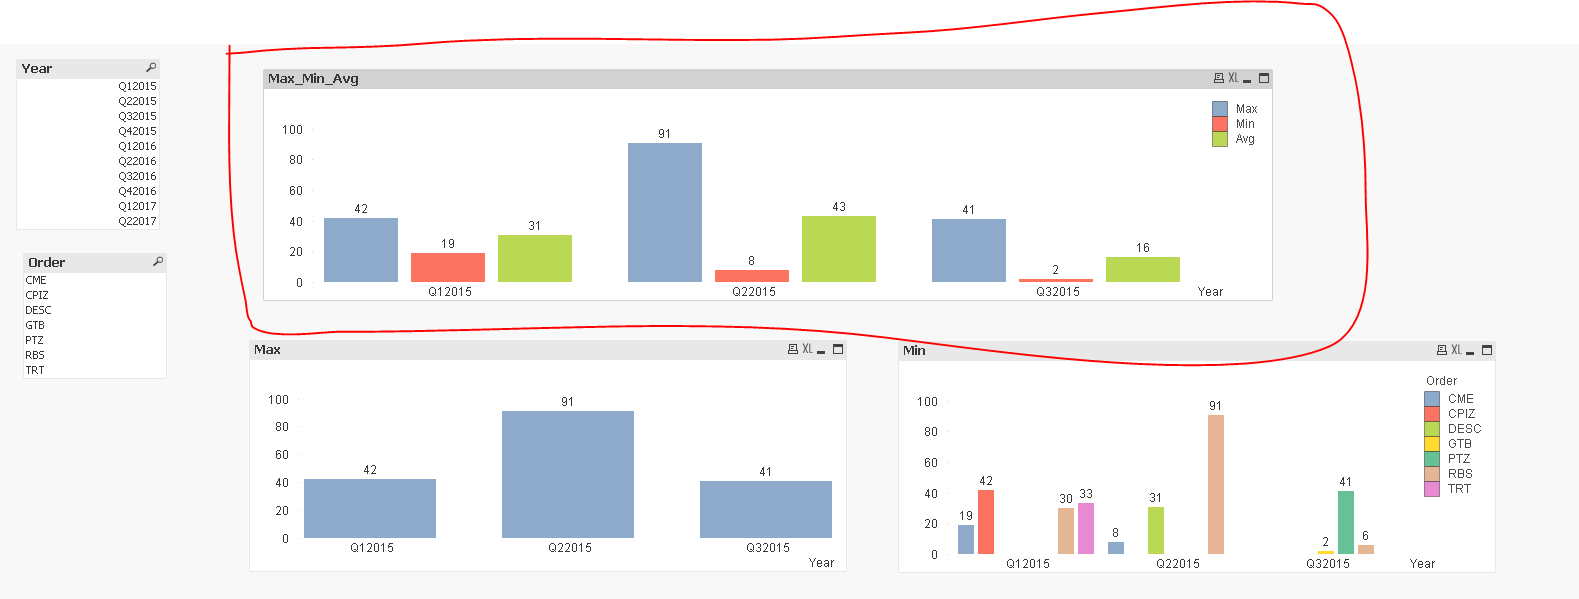
In the attached qvw I’m trying to display the max, min and average value in a quarter not sure how to achieve that. Please help
For example: In Q12015- The chart should display: Max value-42(CPIZ)
Min Value- 19(CME)
Average- (42+19+30+33)/4= 31
Thank you,
Ramya
- « Previous Replies
-
- 1
- 2
- Next Replies »
- Mark as New
- Bookmark
- Subscribe
- Mute
- Subscribe to RSS Feed
- Permalink
- Report Inappropriate Content
Hi Anil,
Thank you for the response. In the attached qvw now there are 3 expressions (max, min and avg). So basically the max expression should display only the maximum number of days in a given quarter (there are multiple orders with different number of days in each quarter). The minimum should display only the lowest number of Days and the average should display the average number of days for all the orders in a given quarter. Also attached an excel with expected output format. Hope this will help you to understand, if it's still not clear please let me know. Thank you so much and appreciate your help.
Ramya
- Mark as New
- Bookmark
- Subscribe
- Mute
- Subscribe to RSS Feed
- Permalink
- Report Inappropriate Content
- Mark as New
- Bookmark
- Subscribe
- Mute
- Subscribe to RSS Feed
- Permalink
- Report Inappropriate Content
Hi Harini,
Thank you for the response actually I used that thread only but my requirement is slightly different. Here all the days(order) were displayed but my requirement is need to show only Max, Min and average days in each quarter.
ramya
- Mark as New
- Bookmark
- Subscribe
- Mute
- Subscribe to RSS Feed
- Permalink
- Report Inappropriate Content
Are you after this
- Mark as New
- Bookmark
- Subscribe
- Mute
- Subscribe to RSS Feed
- Permalink
- Report Inappropriate Content
Hi Sunny,
Thank you so much really appreciate it.
Ramya
- « Previous Replies
-
- 1
- 2
- Next Replies »