Unlock a world of possibilities! Login now and discover the exclusive benefits awaiting you.
- Qlik Community
- :
- All Forums
- :
- QlikView App Dev
- :
- Re: FirstSortedValue - Based on Max Value
- Subscribe to RSS Feed
- Mark Topic as New
- Mark Topic as Read
- Float this Topic for Current User
- Bookmark
- Subscribe
- Mute
- Printer Friendly Page
- Mark as New
- Bookmark
- Subscribe
- Mute
- Subscribe to RSS Feed
- Permalink
- Report Inappropriate Content
FirstSortedValue - Based on Max Value
I am struggling with the following issue. I have attached a sample qvw.
I have a simple table, which breaks down weekly stats for a team. I have a chart that has three dimensions, then does a sum of points. What I'm trying to add is a second expression that shows the player who had the maximum points for the given week.
I have used the FirstSortedValue function and it appears to work, but there is one week where it does not display the correct player.
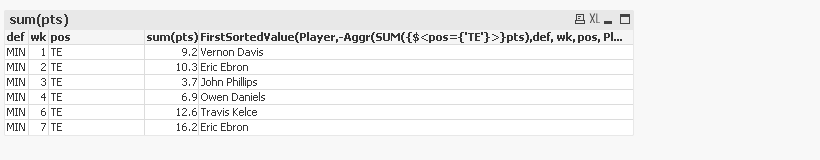
In the attached, you will see the table and chart. I can't figure out why the function returns 'Timothy Wright' in week 7, when it should return 'Eric Ebron' because he had 14.9 pts vs 1.3 for Wright.
Perhaps I should be using an entirely different approach? Please keep in mind this is a small snapshot of the overall dataset, just to illustrate the issue. I have a set analysis built into the expression to show the function as it is in my actual qvw file (even though it is not needed for this small sample). Not sure if it makes a difference.
Thanks
Accepted Solutions
- Mark as New
- Bookmark
- Subscribe
- Mute
- Subscribe to RSS Feed
- Permalink
- Report Inappropriate Content
Hi Joseph, try adding week to the Aggr() function:
FirstSortedValue(DISTINCT Player,-Aggr(SUM({$<pos={'TE'}>}pts),wk,Player))
- Mark as New
- Bookmark
- Subscribe
- Mute
- Subscribe to RSS Feed
- Permalink
- Report Inappropriate Content
Hi Joseph, try adding week to the Aggr() function:
FirstSortedValue(DISTINCT Player,-Aggr(SUM({$<pos={'TE'}>}pts),wk,Player))
- Mark as New
- Bookmark
- Subscribe
- Mute
- Subscribe to RSS Feed
- Permalink
- Report Inappropriate Content
Try this expression:
FirstSortedValue(Player,-Aggr(SUM({$<pos={'TE'}>}pts),def, wk, pos, Player))
- Mark as New
- Bookmark
- Subscribe
- Mute
- Subscribe to RSS Feed
- Permalink
- Report Inappropriate Content
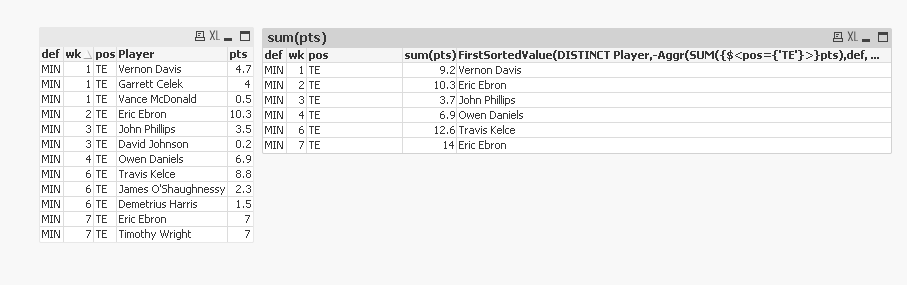
Thank you Ruben and Sunny, I didn't realize you could add multiple columns in the Aggr function. This fixed the issue I was experiencing, and uncovered another.
If I changed the data for wk 7, making the points equal for both Ebron and Wright. Now, the function comes back as NULL as it doesn't know which one to display. Could it be forced to pick one (perhaps based on the alpha sort on Player)?
Here is updated load script. I couldn't not repost the sample qvw. Chart now shows NULL for week 7.
PlayerData:
load * inline
[
def, wk, pos, Player, pts
MIN, 1, TE, Vernon Davis, 4.7
MIN, 1, TE, Garrett Celek, 4
MIN, 1, TE, Vance McDonald, 0.5
MIN, 2, TE, Eric Ebron, 10.3
MIN, 3, TE, John Phillips, 3.5
MIN, 3, TE, David Johnson, 0.2
MIN, 4, TE, Owen Daniels, 6.9
MIN, 6, TE, Travis Kelce, 8.8
MIN, 6, TE, James O'Shaughnessy, 2.3
MIN, 6, TE, Demetrius Harris, 1.5
MIN, 7, TE, Eric Ebron, 7
MIN, 7, TE, Timothy Wright, 7
];
- Mark as New
- Bookmark
- Subscribe
- Mute
- Subscribe to RSS Feed
- Permalink
- Report Inappropriate Content
Distinct should help in that case:
FirstSortedValue(DISTINCT Player,-Aggr(SUM({$<pos={'TE'}>}pts),def, wk, pos, Player))
- Mark as New
- Bookmark
- Subscribe
- Mute
- Subscribe to RSS Feed
- Permalink
- Report Inappropriate Content
Hi Joseph, same expression works for me:
FirstSortedValue(DISTINCT Player,-Aggr(SUM({$<pos={'TE'}>}pts),wk,Player))

- Mark as New
- Bookmark
- Subscribe
- Mute
- Subscribe to RSS Feed
- Permalink
- Report Inappropriate Content
Thank you Ruben, you had the DISTINCT in there all along.
- Mark as New
- Bookmark
- Subscribe
- Mute
- Subscribe to RSS Feed
- Permalink
- Report Inappropriate Content
Thank you Sunny, appreciate the quick replies.