Unlock a world of possibilities! Login now and discover the exclusive benefits awaiting you.
- Qlik Community
- :
- All Forums
- :
- QlikView App Dev
- :
- Re: Fix Selection (Chart Expression, Set Analysis)
- Subscribe to RSS Feed
- Mark Topic as New
- Mark Topic as Read
- Float this Topic for Current User
- Bookmark
- Subscribe
- Mute
- Printer Friendly Page
- Mark as New
- Bookmark
- Subscribe
- Mute
- Subscribe to RSS Feed
- Permalink
- Report Inappropriate Content
Fix Selection (Chart Expression, Set Analysis)
My chart currently looks as follows:
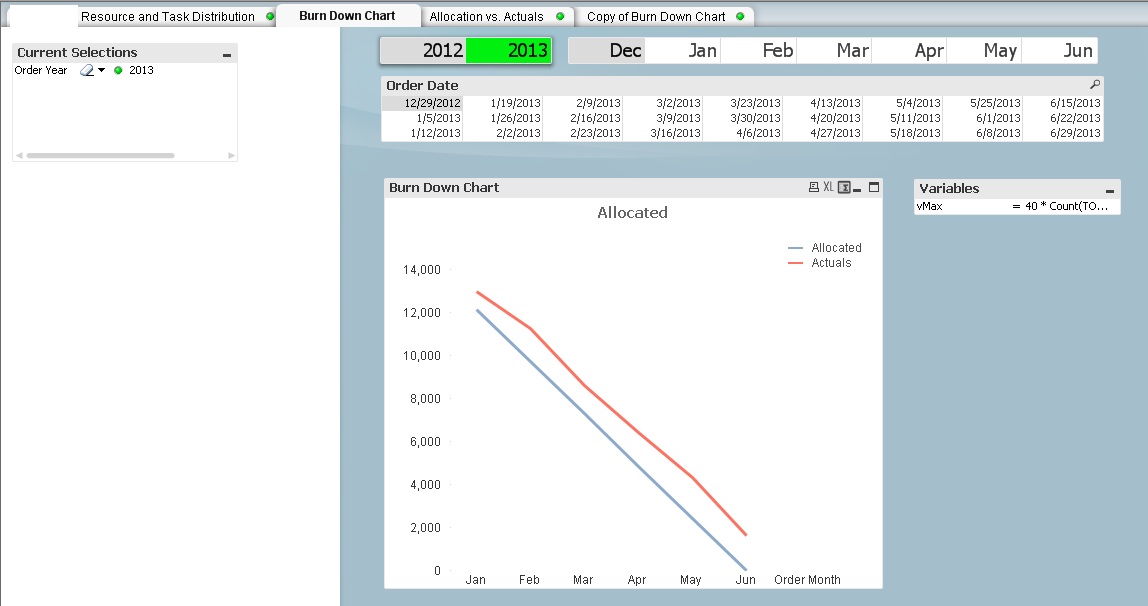
Here is what I have done so far:
For the maximum budget (of hours), I created a variable named vMax. As of now, it's defined as 40 * Count(TOTAL DISTINCT([Resource Name])) * Count(TOTAL DISTINCT([Order Date])).
I then used vMax for the expressions for Allocated and Actuals.
For Allocated, I have: =$(vMax) - num([Order Month]) * $(vMax)/(Count(TOTAL DISTINCT([Order Month]))).
The screencap above is exactly how I want my chart to look like. I also checked the numbers and they're correct.
However, I want to ignore year, month and date selections. I want the year to be fixed to 2013.
I tried using set analysis in my chart expressions as follows:
vMax = 40 * Count({<[Order Month]=,[Order Date]=,[Order Year]={2013}>}TOTAL DISTINCT([Resource Name])) * Count({<[Order Month]=,[Order Date]=,[Order Year]={2013}>}TOTAL DISTINCT([Order Date]))
Allocated = $(vMax) - num([Order Month]) * $(vMax)/(Count({<[Order Month]=,[Order Date]=,[Order Year]={2013}>}TOTAL DISTINCT([Order Month]))
However, it's not behaving the way I want to. I could still select year, month and date and the chart will change based on my selections.
I also tried removing the keyword TOTAL in all of my expressions, but I ended up with a completely different chart.
Could you guide me on how I can fix my current selection to year 2013 and ignore all the other selections?
THANK YOU in advance!
- Tags:
- new_to_qlikview
Accepted Solutions
- Mark as New
- Bookmark
- Subscribe
- Mute
- Subscribe to RSS Feed
- Permalink
- Report Inappropriate Content
Allocated = $(vMax) - only({<[Order Month]=,[Order Date]=,[Order Year]={2013}>} [Order Month]) * $(vMax)/(Count({<[Order Month]=,[Order Date]=,[Order Year]={2013}>}TOTAL DISTINCT([Order Month]))