Unlock a world of possibilities! Login now and discover the exclusive benefits awaiting you.
- Qlik Community
- :
- All Forums
- :
- QlikView App Dev
- :
- Re: Fix Values in Formula
- Subscribe to RSS Feed
- Mark Topic as New
- Mark Topic as Read
- Float this Topic for Current User
- Bookmark
- Subscribe
- Mute
- Printer Friendly Page
- Mark as New
- Bookmark
- Subscribe
- Mute
- Subscribe to RSS Feed
- Permalink
- Report Inappropriate Content
Fix Values in Formula
Hello Guys,
I need some help. Actually i have this formula in a chart bar :
=avg(aggr(count({<[Fabricante_Codigo]={'344'}, Data={">$(=Date(addMonths(max(Data),-12)))<=$(=Date(max(Data)))" },Segmento={'Naked Big'} >}[Numero_Chassis]), Mesano))
With this calculated dimension:
=if(Date(Data) >= Date(MonthStart(AddMonths(Today(), -12))), Mesano)
This chart shows me 12 bars, about last 12 months. But, if somebody select a previous month (July, for example), it shows only 1 bar.
I've tried to set '1' in the set analysis, but it didnt worked, nothing change. My field 'Mesano' is the concatenation of :
Month & '-' & Year
The aggr function is to set the correct order of months. If i only use the Count formula, the months stays out of order.
How can i solve this?
Thanks !
- Mark as New
- Bookmark
- Subscribe
- Mute
- Subscribe to RSS Feed
- Permalink
- Report Inappropriate Content
Suraj,
Yes, i've inserted the '1' in the expression, thank you for the observation.
Now, this 2 formulas works, but selecting a value, none order correctly.
How can we solve this?
Thank you,
Morandi
- Mark as New
- Bookmark
- Subscribe
- Mute
- Subscribe to RSS Feed
- Permalink
- Report Inappropriate Content
You definitely don't need a calculated dimension here. Go to the Sort tab of your chart and define your sort order there. The problem is that Mesano is a text concatenation instead of a true date. You can either fix that in the script (which is the correct way of doing it) or hack it in the Sort. If you want to do the latter, select "Expression" under Sort and set this as your expression:
date#(Mesano,'MMM-YYYY')
I'm guessing that's your date format, but if not just replace it with the correct format. The correct way of doing it of course is to make Mesano a true date field in the script.
Vlad
- Mark as New
- Bookmark
- Subscribe
- Mute
- Subscribe to RSS Feed
- Permalink
- Report Inappropriate Content
what is the order you are looking for? Write in an expression and paste it in the sort tab expression dialog and remove all selections in the Sort tab.
Thanks
Suraj
- Mark as New
- Bookmark
- Subscribe
- Mute
- Subscribe to RSS Feed
- Permalink
- Report Inappropriate Content
Suraj, the {1} set is not the correct way of doing things here. We don't typically want to ignore all QV selections. That's not a real solution.
Vlad
- Mark as New
- Bookmark
- Subscribe
- Mute
- Subscribe to RSS Feed
- Permalink
- Report Inappropriate Content
Hello Vlad,
Yes, you correct, but i didnt mentioned that this is a chart for a report, which the only thing that i need to change is the Data.
But, you are correct !
Thank you !
- Mark as New
- Bookmark
- Subscribe
- Mute
- Subscribe to RSS Feed
- Permalink
- Report Inappropriate Content
Oh k. if it should not change with Mesano, then it should be like this
count({<Messano= ,[Fabricante_Codigo]={'344'}, Data={">$(=Date(addMonths(max(Data),-12)))<=$(=Date(max(Data)))" },Segmento={'Naked Big'} >}[Numero_Chassis])
Thanks
Suraj
- Mark as New
- Bookmark
- Subscribe
- Mute
- Subscribe to RSS Feed
- Permalink
- Report Inappropriate Content
Hello Vlad,
Sorry, it worked without selection, with selection, it stays out of order.
Do you think that in script is the only way?
Thanks!
- Mark as New
- Bookmark
- Subscribe
- Mute
- Subscribe to RSS Feed
- Permalink
- Report Inappropriate Content
No, it's not the only way--the Sort tab method should work just fine, regardless of selections. You've removed the calculated dimension, right?
Vlad
- Mark as New
- Bookmark
- Subscribe
- Mute
- Subscribe to RSS Feed
- Permalink
- Report Inappropriate Content
Hello Suraj,
What i mean is this:
If its nothing selected, the sort stays correct.
If i select a previous month, it stays out of order.
Here goes a example:
Here, i dont have nothing selected.
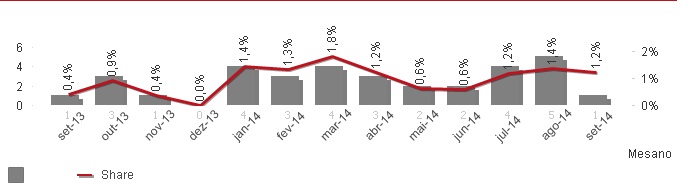
Here i selected July.
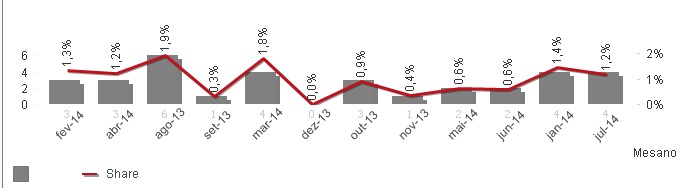
As you can see, the year 2013 and 2014 is in a random sort.
My expression in sort tab is this (working and fine):
date#(Mesano,'MMM-YY')
Any idea?
Thanks,
Morandi
- Mark as New
- Bookmark
- Subscribe
- Mute
- Subscribe to RSS Feed
- Permalink
- Report Inappropriate Content
There must be something unusual going on that's specific to your app. If you need more help, post a reduced example.
Regards,
Vlad