Unlock a world of possibilities! Login now and discover the exclusive benefits awaiting you.
- Qlik Community
- :
- All Forums
- :
- QlikView App Dev
- :
- Flagging rows in one table whether they match rows...
- Subscribe to RSS Feed
- Mark Topic as New
- Mark Topic as Read
- Float this Topic for Current User
- Bookmark
- Subscribe
- Mute
- Printer Friendly Page
- Mark as New
- Bookmark
- Subscribe
- Mute
- Subscribe to RSS Feed
- Permalink
- Report Inappropriate Content
Flagging rows in one table whether they match rows in another table or not
Hi all,
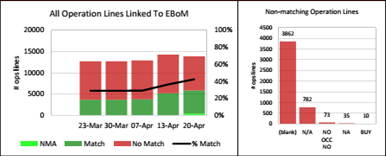
I have two tables that I want to compare on a single column, but the other columns are different in both tables - I want to be able to flag the rows in Table A whether there is a match or not for that same column in Table B, then display Table B with the Match column. Table A and B may have duplicate entries in the column to be matched on, so I don't think using EXISTS or NOT EXISTS will work (having looked at https://community.qlik.com/thread/111999) - I'm trying to get a chart to look like this:

Ignore the dates, I just want to get a single date snapshot at the moment. Table A (Ops Lines) has say 25k rows, and I want to check how many of those lines match Table B (EBoM) on column X. Then I need to take all the non-matching lines and create the graph on the right, showing the breakdown of the non-matching lines. Table A contains multiple rows that are blank for column X, plus multiple rows where the value is N/A, NMA, BUY etc, but most rows have a unique value for column X
Hope you can help!
Damian
Accepted Solutions
- Mark as New
- Bookmark
- Subscribe
- Mute
- Subscribe to RSS Feed
- Permalink
- Report Inappropriate Content
have you tried Applymap
load mapping table with Load distinct X from table A,
then create a flag in table B if it match give X if not give 'No match' as Flag (Using ApplyMap)
Then use this column in your expression
Thanks
BKC
- Mark as New
- Bookmark
- Subscribe
- Mute
- Subscribe to RSS Feed
- Permalink
- Report Inappropriate Content
Hi Balkumar,
That has worked perfectly - thanks for the help!
Damian