Unlock a world of possibilities! Login now and discover the exclusive benefits awaiting you.
- Qlik Community
- :
- All Forums
- :
- QlikView App Dev
- :
- Forecast in QlikView
Options
- Subscribe to RSS Feed
- Mark Topic as New
- Mark Topic as Read
- Float this Topic for Current User
- Bookmark
- Subscribe
- Mute
- Printer Friendly Page
Turn on suggestions
Auto-suggest helps you quickly narrow down your search results by suggesting possible matches as you type.
Showing results for
Not applicable
2015-12-24
04:22 AM
- Mark as New
- Bookmark
- Subscribe
- Mute
- Subscribe to RSS Feed
- Permalink
- Report Inappropriate Content
Forecast in QlikView
Hi Guys,
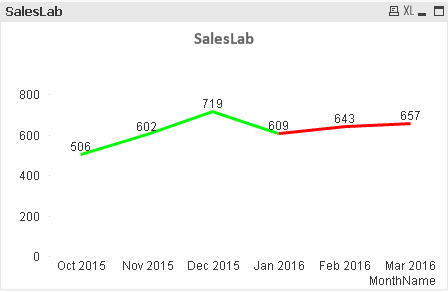
I am attempting to create a Sales Forecast using QlikView and basing forecast sales on the past 3 months actual sales.
i.e.
October Sales = 506
November Sales = 602
December Sales = 719
January should be = 609 (506+602+719) / 3
February should be = 643 (602+719+609) / 3
March should be = 657 (719+609+643) / 3
I would like to plot this in a QlikView chart.
Any ideas will be greatly appreciated.
- Tags:
- new_to_qlikview
1,800 Views
1 Solution
Accepted Solutions
MVP
2015-12-24
06:31 AM
- Mark as New
- Bookmark
- Subscribe
- Mute
- Subscribe to RSS Feed
- Permalink
- Report Inappropriate Content
1,186 Views
2 Replies
MVP
2015-12-24
06:31 AM
- Mark as New
- Bookmark
- Subscribe
- Mute
- Subscribe to RSS Feed
- Permalink
- Report Inappropriate Content
PFA
Red line - Forecast
Green line - Actual
1,187 Views
Not applicable
2015-12-24
08:52 AM
Author
- Mark as New
- Bookmark
- Subscribe
- Mute
- Subscribe to RSS Feed
- Permalink
- Report Inappropriate Content
Thank you.
1,186 Views