Unlock a world of possibilities! Login now and discover the exclusive benefits awaiting you.
- Qlik Community
- :
- All Forums
- :
- QlikView App Dev
- :
- Re: Formatting a Stacked Bar Chart
- Subscribe to RSS Feed
- Mark Topic as New
- Mark Topic as Read
- Float this Topic for Current User
- Bookmark
- Subscribe
- Mute
- Printer Friendly Page
- Mark as New
- Bookmark
- Subscribe
- Mute
- Subscribe to RSS Feed
- Permalink
- Report Inappropriate Content
Formatting a Stacked Bar Chart
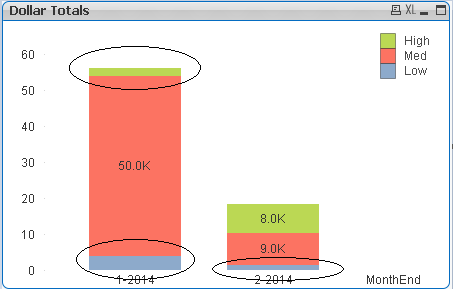
I have created a stacked bar chart in which I want to place the values of the data points. When the segment of the chart is too small the value does not appear (unless you mouse over the area and you see a pop up).
How do I force the segments to be larger so the values will appear in the chart. I have tried placing values in the Static Min value for each of the segments but nothing seems to work. See the circled areas below that where there are no values shown.
I have attached a sample Qlilview app with this chart.
Can anyone provide me with any ideas as to how to display all the values within the chart?
Thanks,
Ed T.
- Tags:
- new_to_qlikview
- « Previous Replies
-
- 1
- 2
- Next Replies »
- Mark as New
- Bookmark
- Subscribe
- Mute
- Subscribe to RSS Feed
- Permalink
- Report Inappropriate Content
You can do it by changing static min, max and step in axis. I have done in your app, 1 appears in first chart. Please find attached
- Mark as New
- Bookmark
- Subscribe
- Mute
- Subscribe to RSS Feed
- Permalink
- Report Inappropriate Content
How did you determine the values to use in the static min, max and step in axis?
Ed
- Mark as New
- Bookmark
- Subscribe
- Mute
- Subscribe to RSS Feed
- Permalink
- Report Inappropriate Content
I play with different possible scale to get the idea.
- Mark as New
- Bookmark
- Subscribe
- Mute
- Subscribe to RSS Feed
- Permalink
- Report Inappropriate Content
Thanks for the help. I will keep "playing" with this to see if I can get better results.
Ed
- Mark as New
- Bookmark
- Subscribe
- Mute
- Subscribe to RSS Feed
- Permalink
- Report Inappropriate Content
Hi,
see my approach...
Regards
André Gomes
- Mark as New
- Bookmark
- Subscribe
- Mute
- Subscribe to RSS Feed
- Permalink
- Report Inappropriate Content
It looks like you simply made the chart larger so it would show the data. Unfortunately I am under some size constraints on my production application and need to stick to the my original sizes for the chart.
Thanks.
- Mark as New
- Bookmark
- Subscribe
- Mute
- Subscribe to RSS Feed
- Permalink
- Report Inappropriate Content
He has also made the font within the chart smaller.
- Mark as New
- Bookmark
- Subscribe
- Mute
- Subscribe to RSS Feed
- Permalink
- Report Inappropriate Content
Changing some segments distorts information, defying the meaning of the chart. I'd recommend to use grouped, horizontal, if numbers must be shown
- Mark as New
- Bookmark
- Subscribe
- Mute
- Subscribe to RSS Feed
- Permalink
- Report Inappropriate Content
I agree with you that this will misrepresent the data in the chart. However the customer requirements are for a vertical stacked bar chart and as we all know "The customer is always right".
Thanks for the feedback.
- « Previous Replies
-
- 1
- 2
- Next Replies »